
Compare your game with benchmarks
Benchmark scales show how your game performs alongside other projects.
How to use it
- In game analytics, open Benchmarks or Retention.
- Choose a day or a 7-day average.
- Compare the game's marker with P50 and P90. Then open metric history to see how it changes.
Advice and practical context
Position in a peer set
The scale places your game's measured KPI against the selected Roblox comparison set. P50 is the distribution midpoint and P90 a high reference; distance between them is not a linear score of quality or revenue.
From diagnosis to action
Low D1 points toward onboarding, while low average session time suggests reviewing the core loop and performance. Inspect segments and history next. Do not optimize for the band while ignoring guardrails and player experience.
Different KPIs identify different constraints: strong ARPPU with weak conversion is not the same as both being weak. Choose an action based on the metric's mechanism, then verify that another part of the player experience did not deteriorate.
Technical detailsCalculations, permissions and behavior
Instructions for each chart
The book beside a chart opens its metric-specific explanation: meaning, calculation, limitations and testable actions. Conversion codes appear in chart titles and summary cards. Product charts start with the top ten enabled; manual choices persist.
If all lines are off, enable them in the legend. Per-player mode requires DAU for the same date.
Six primary benchmarks
The Benchmarks tab starts with six comparable cards: average playtime, D1 retention, D7 retention, payer conversion, average revenue per paying user and Home recommendation play-through rate. By default, Latest selects the available date per card and shows it in the hover tooltip: D1 and D7 may lag revenue. Choosing a calendar date leaves Latest mode.
One Daily / 7-day average switch updates the window for every card. A calendar with arrows sits beside it: Daily shows one selected date, while the seven-day mode shows the exact rolling seven-day range. Each arrow shifts the selected end date by one day.
Each benchmark uses its last confirmed day no later than the selection, with the actual day or seven-day range available in its hover tooltip. D1 and D7 are dated by the cohort's first join and require 1 or 7 days of observation plus Roblox processing. The tooltip marks older periods as latest available.
A connected helper prioritizes the selected history. Value, exact percentile, P50, P90 and change come from one scorecard for the same date and window; daily percentiles are never averaged into seven-day percentiles. If no confirmed data exist, the value or gauge is not invented.
Analytics Query API ratios are normalized to percentages only for percentage metrics. Each card opens the corresponding chart in the correct analytics section. ARPPU uses the hexagonal Robux symbol.
Retention: chart order and benchmarks
The section starts with the new-user first-session retention curve styled after Creator Dashboard: the large value is the share still playing after five minutes, with an elapsed-time axis from launch to minute 30. The chart has its own request and refresh button; an open tab checks stored results every minute without waiting for other breakdowns. MARPLA requests the official TotalSessionsEndedInBucket metric broken down by SessionTimeBucket and stores all daily observations without a top-30 limit.
Numeric values 0, 30, 60, …, 1800 mean seconds; each count already represents surviving players. Over the selected dates, MARPLA divides the summed count at each second by the summed count at launch, never adds different thresholds or averages daily percentages. Duplicate days are not added.
The period ends on the latest complete observation day, not the sync date. If the selected day is not ready, the previous complete day is shown; actual dates are always visible below the heading. Ranges aggregate daily cohorts through the latest available day.
Incomplete range history falls back to an explicitly dated latest complete day without inventing missing values. A partial refresh does not erase the saved chart. The exact five-minute value appears only when its observations are present.
Smoothing changes only the line between confirmed points. Average playtime and Average session time follow. Both daily charts render a gray band only from stored exact Roblox P50–P90 boundaries for the comparable population; MARPLA neither substitutes an estimated range nor bridges missing benchmark points.
D1, D7 and D30 retention and the remaining return metrics follow. If Roblox has not returned the observations or benchmark yet, the interface shows missing data instead of a fabricated line.
Useful articles: examples and decisions
The guide covers the steps in the service. These articles explain the metrics, examples, techniques and how to evaluate results.
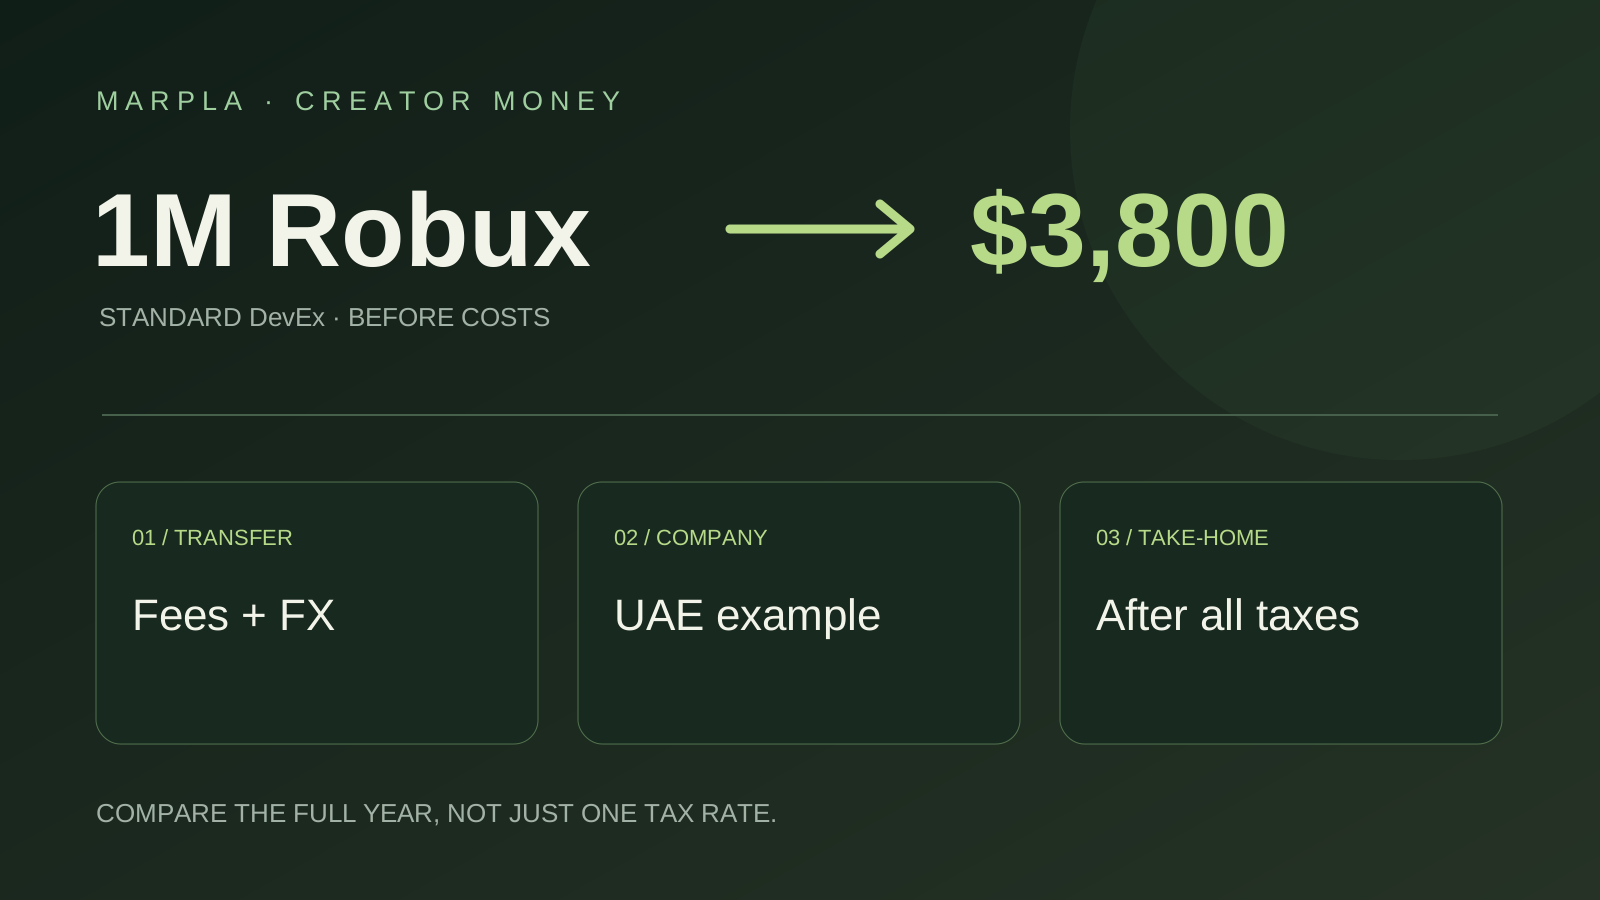
Where to Cash Out Robux: Simple Choices and a UAE Company Example
Keep more of your Robux earnings: bank versus PayPal, payout examples, and UAE companies earning $100,000 or $200,000 a year. A short practical guide.
Read article →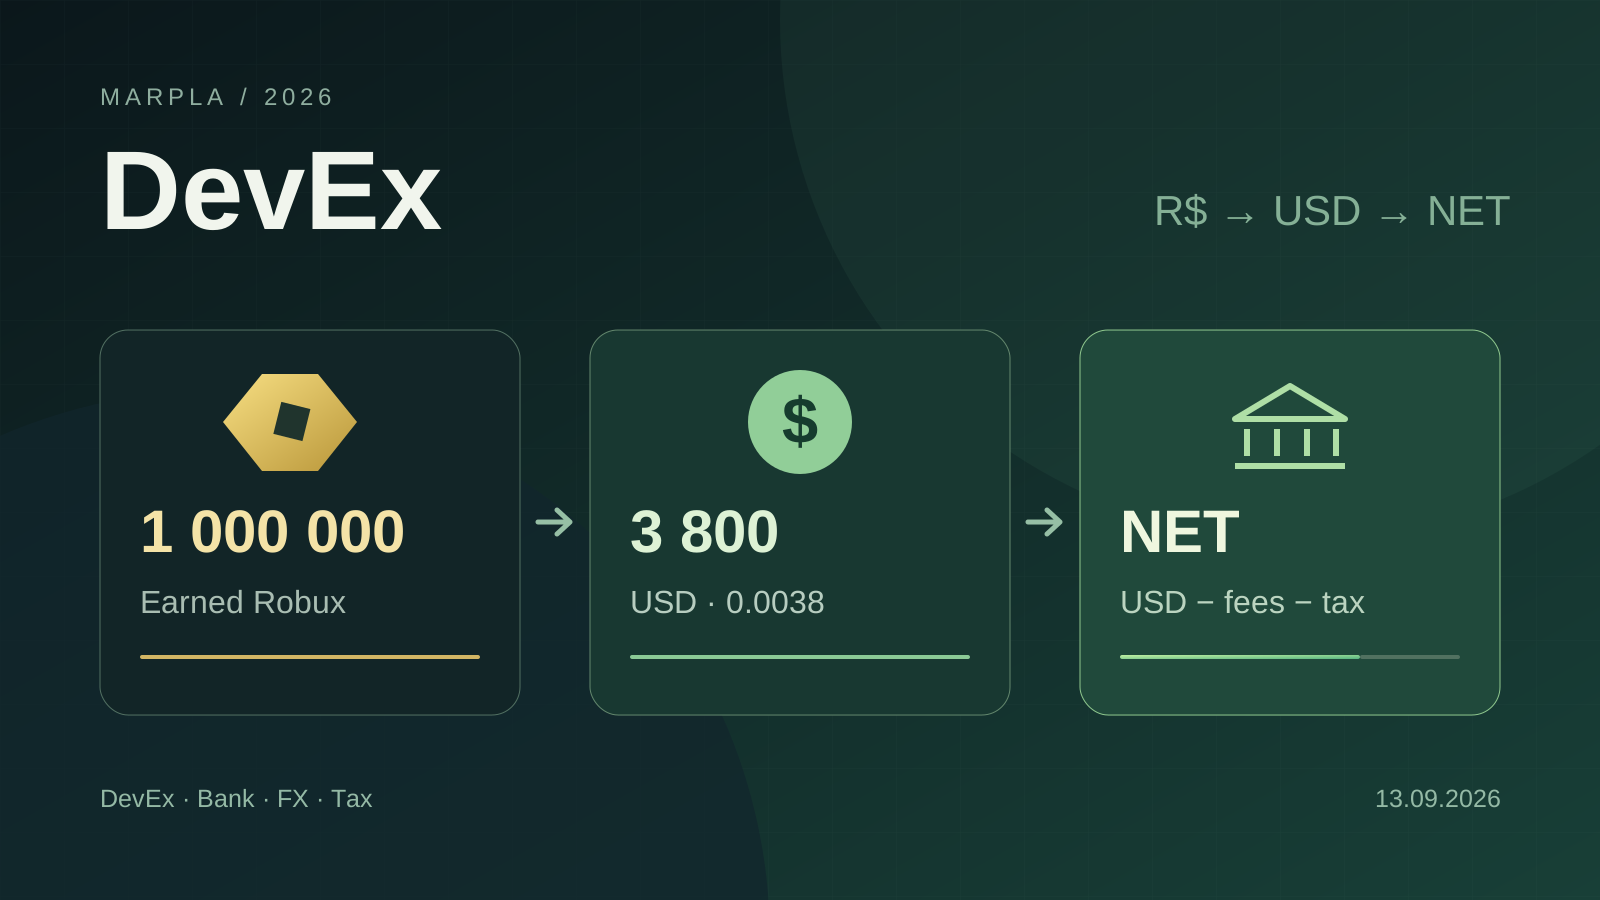
How to Cash Out Robux: DevEx, Fees, Crypto, and Taxes in 2026
DevEx rates of $0.0038 and $0.0054, real cash-out costs, net income calculations, taxes in different countries, and the rules taking effect in November 2026.
Read article →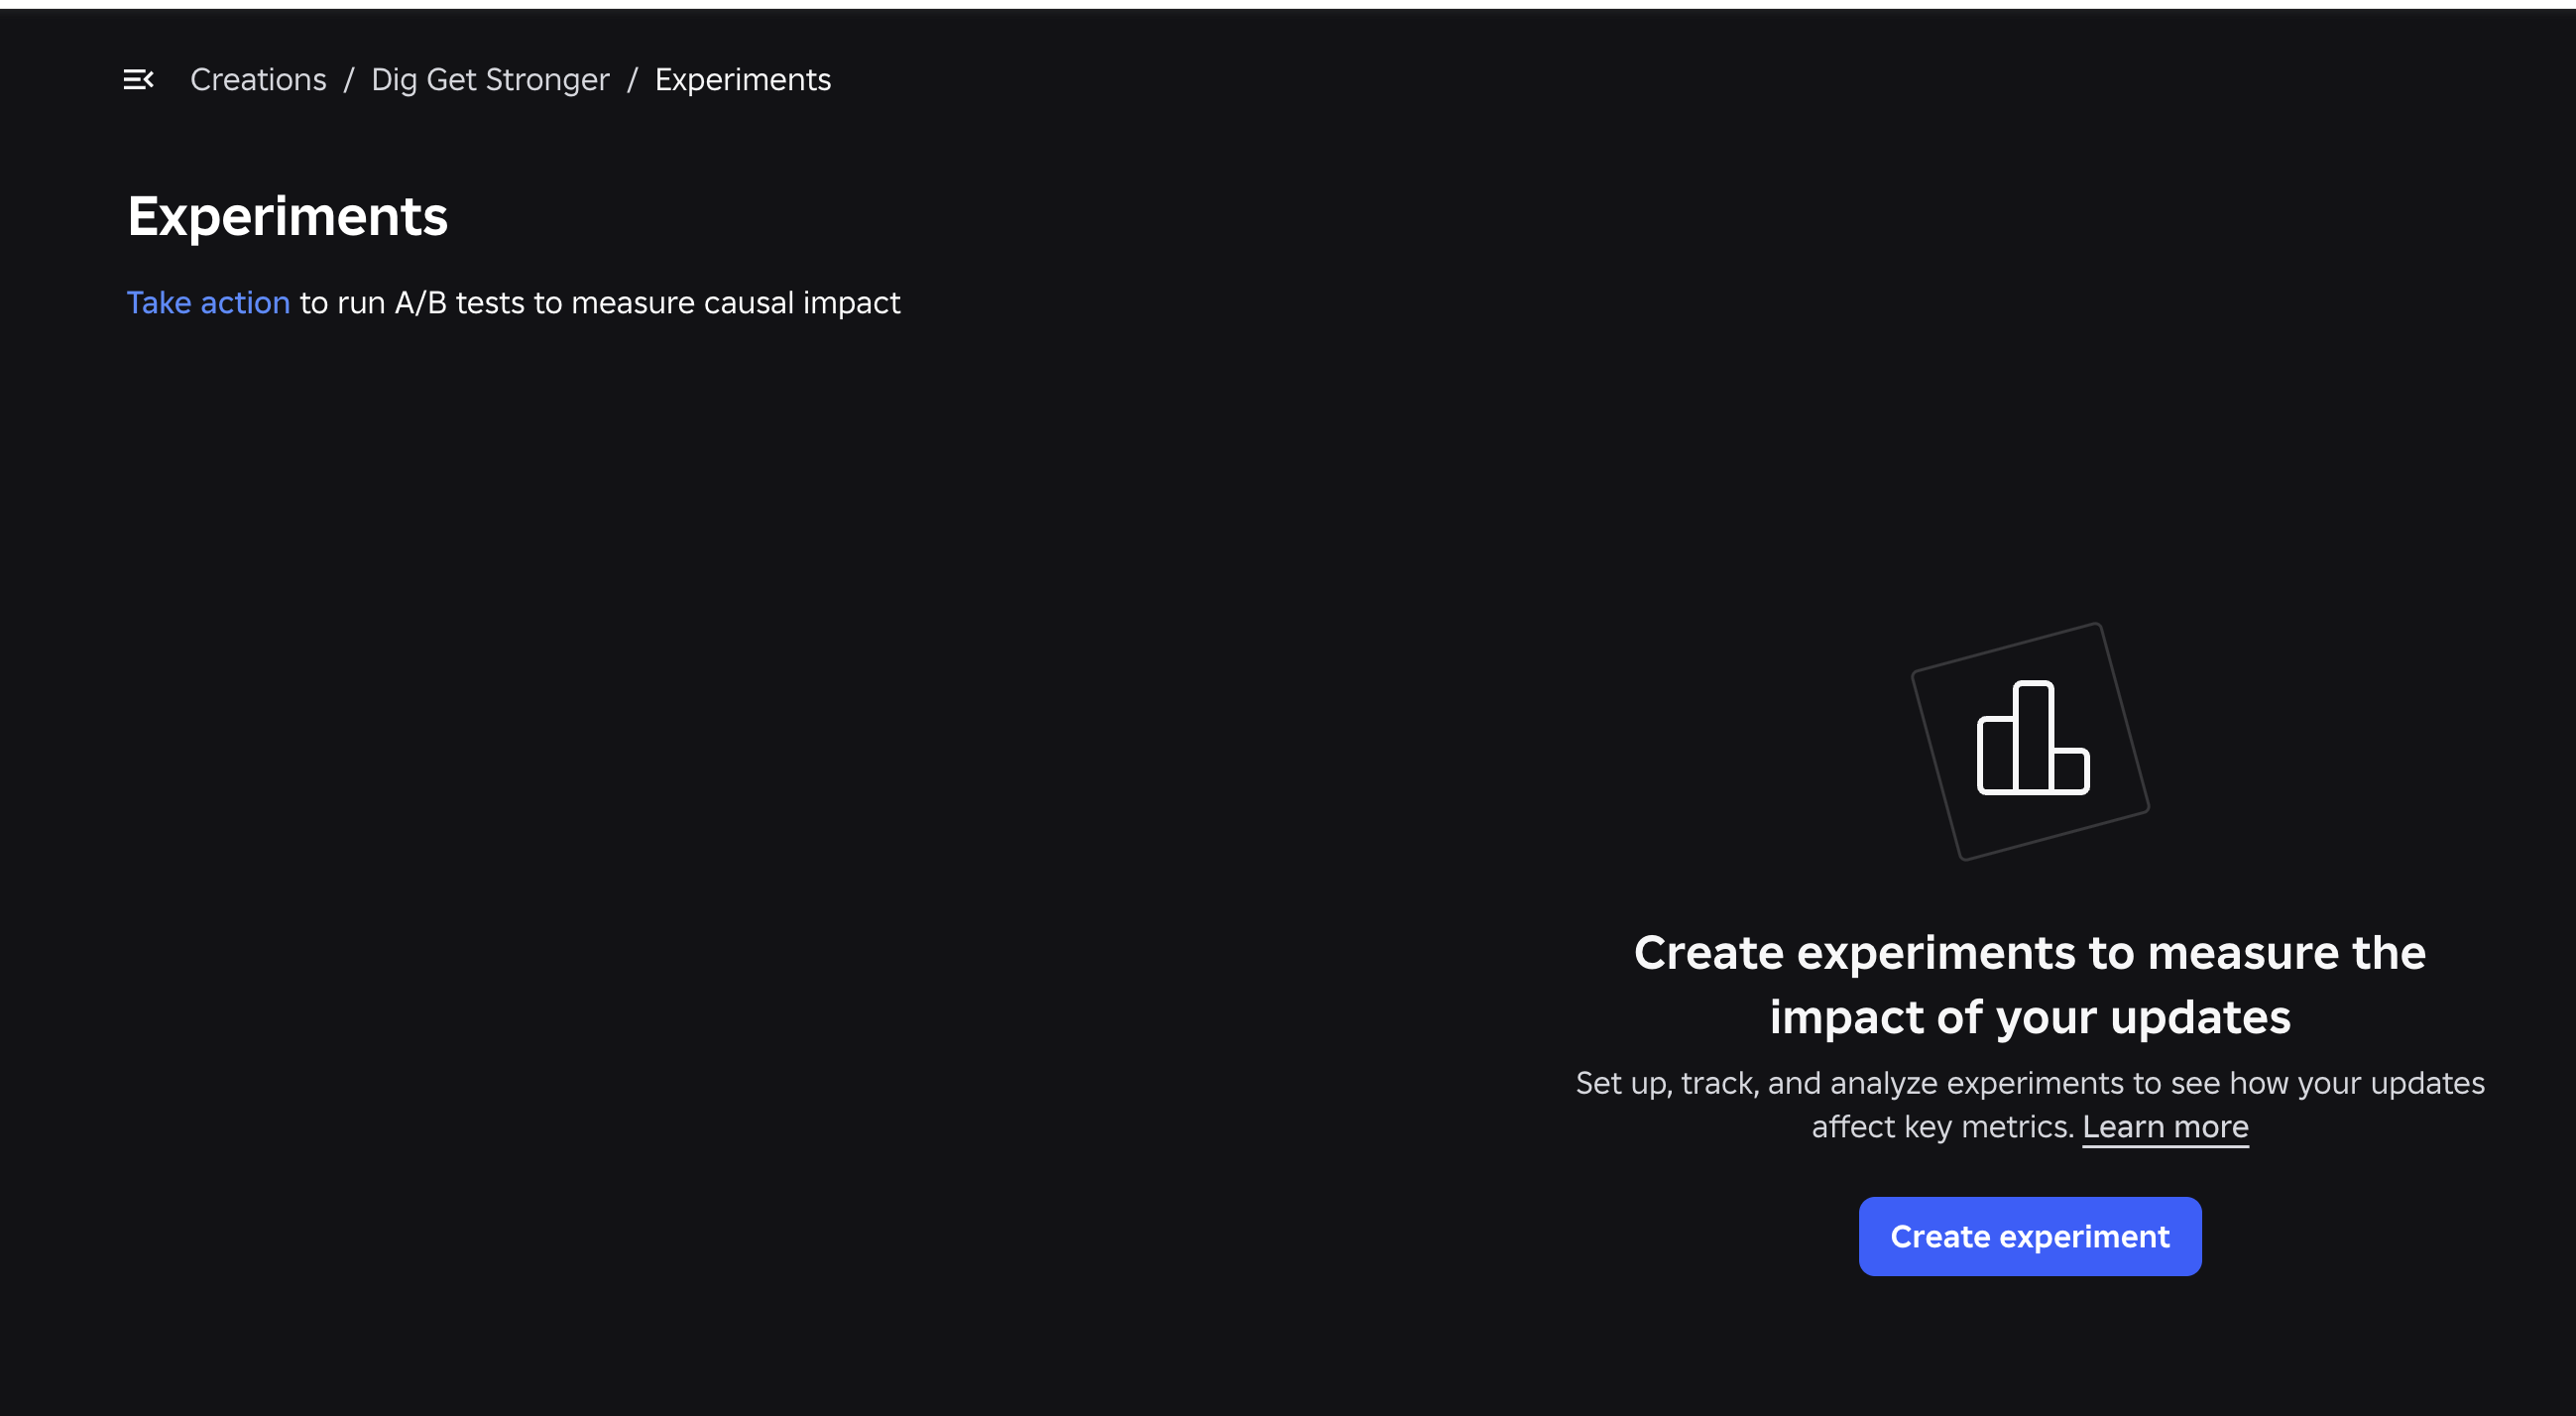
Roblox Experiments: how to run A/B tests and improve your game
Set up Roblox Experiments, select metrics and evaluate A/B tests: 8 game test ideas, creator case studies, interpretation pitfalls and an experiment template.
Read article →
How to improve a Roblox game's first session and retention
Move from observed playtests and an onboarding funnel to mature D1/D7 cohorts and testable changes.
Read article →
How to evaluate a Roblox update without claiming false causality
Plan the measurement, align cohorts and windows, inspect confounders, and reserve causal language for controlled experiments.
Read article →Action essentials and individual concepts (14)
 Roblox first session: diagnosis plan
 Roblox Experiments: a short A/B test plan
 Roblox first-session funnel: events you can trust
 Roblox first-session diagnosis: from loss shape to repair
 Roblox Experiments randomization: set up a causal test
 Roblox Experiments results: decide without chasing green metrics
 Robux cash-out essentials: a pre-payout checklist
 DevEx essentials: eligibility, payout, and records
 Roblox update evaluation: the essential before-and-after plan
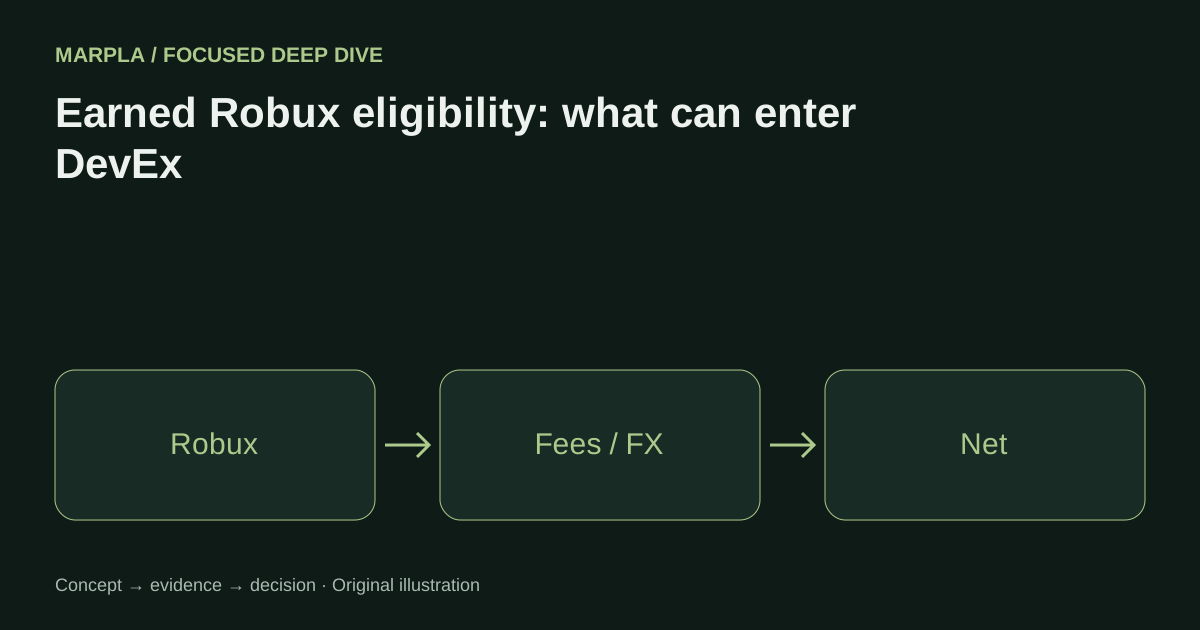 Earned Robux eligibility: what can enter DevEx
 DevEx payout fees and FX: compare the amount that lands
 DevEx tax status and documents: a residency-first checklist
 DevEx net cash-out calculation: a line-by-line model
 Crypto after DevEx: a separate treasury decision