
Game analysis
Before-and-after update analysis: baselines and confounders
A before-and-after chart measures coincidence around a release. It can support a decision when the plan, baseline, and competing explanations are explicit, but it does not create causality by itself. Use it with the [update evaluation guide](/en/resources/evaluate-game-updates); choose a controlled [Roblox experiment](/en/resources/roblox-experiments-guide) when the decision and traffic permit.
Focused deep dive
Design the comparison before release
Write the audience, change, primary metric, guardrails, expected direction, observation window, and decision rule. Save the exact deployment time and version. Choose a baseline with the same weekdays, hours, regions, platforms, acquisition sources, and cohort maturity where possible. If a seasonal event or campaign is unavoidable, include it in the plan rather than discovering it after the result.
Confounders are changes that can move the outcome alongside the update: ads, Home exposure, influencer activity, price changes, platform outages, holidays, another release, tracking changes, or a different player mix. Check them before interpreting the primary metric. Report “metric changed after release” separately from “release caused the change.”
Worked example: D1 rises after onboarding
A team shortens onboarding on Monday. D1 for Monday’s new users is 18%, compared with 14% for the previous Monday, while new-user volume rises from 5,000 to 12,000. At first this looks positive. Acquisition, however, shows a large Home cohort replacing paid traffic, and country mix shifts. The comparison combines a product change with a different audience.
Segmenting by source and country shows the largest stable cohort moved from 15% to 17%, while the new Home cohort is 19%. The safe conclusion is that overall D1 rose and the onboarding change may have contributed, but audience mix also changed. The team can run an eligible controlled experiment or repeat the release logic on a matched cohort before committing a wider redesign.
Run a defensible observational review
Keep the original plan and the final interpretation together so post-hoc metric switching is visible.
- Freeze the primary metric, guardrails, baseline, and decision threshold.
- Mark release, campaign, outage, and other event timestamps.
- Wait until required cohorts mature.
- Segment only on predeclared or clearly material mix changes.
- Choose ship, rollback, or follow-up test and record uncertainty.
False certainty in update reviews
Do not compare a weekend release with a weekday baseline, mature D7 with incomplete D7, or a small country slice with the whole audience. Avoid selecting the best metric after looking at many. A large percentage from a small denominator can be noise; include counts and intervals where available.
Regression to the mean can make a change after an unusually bad week look successful. Novelty can raise short-term engagement and then fade. Tracking changes can imitate product changes. If the decision is expensive or irreversible, the limits of before-and-after evidence justify a controlled test or staged rollout.
Decision record
Keep the preregistered plan, release timestamp, result, confounder check, and final action together. If the team changes the primary metric or window, date and explain the change, then treat it as exploratory evidence that needs confirmation.
Primary sources
Put this into practice in MARPLA
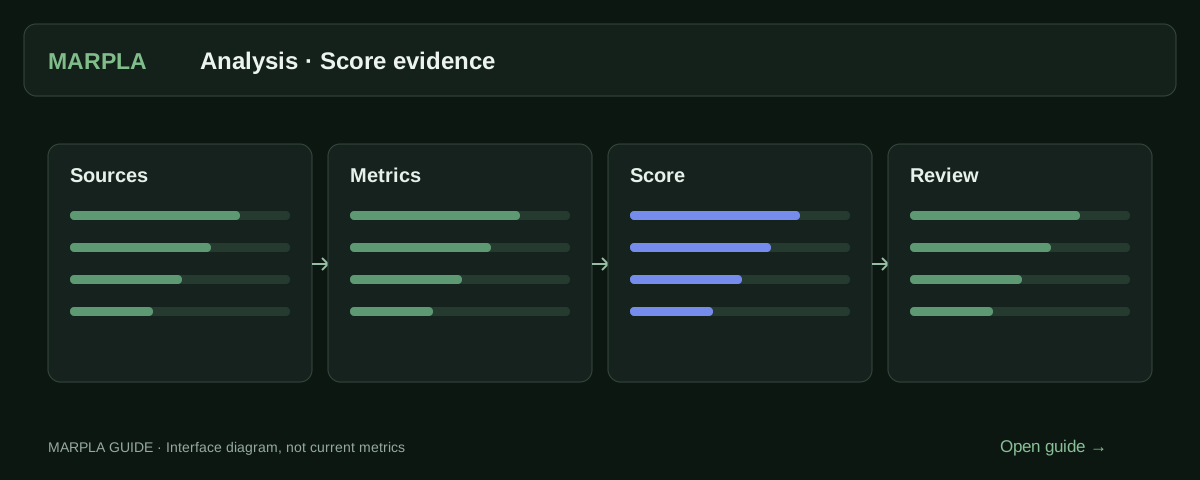
Select a game in Analysis and inspect its sources and score components. Use them to choose your next research question rather than treating the score as a verdict on success.
- Start analyzing a gamePublic analysis helps you explore a game's audience, activity and rating.Step-by-step guide →
- Understand scores and riskScores help you choose projects for a closer look.Step-by-step guide →
Where this deep dive applies
Continue exploring
More on this topic →
How to evaluate a Roblox update without claiming false causality
Plan the measurement, align cohorts and windows, inspect confounders, and reserve causal language for controlled experiments.
Read article
Roblox Experiments: how to run A/B tests and improve your game
Set up Roblox Experiments, select metrics and evaluate A/B tests: 8 game test ideas, creator case studies, interpretation pitfalls and an experiment template.
Read article
Public Roblox data vs owner analytics
Know what can be observed from the market, what requires permission, and where public estimates must stop.
Read article
Discussion0
Loading comments…