
Comparing games
How to compare Roblox games fairly
A leaderboard answers who is largest; it rarely answers which game is executing better. Fair comparison requires games at similar stages, measurements from the same periods, and metrics suited to the question. A two-week-old game should not be judged by lifetime Visits against a five-year-old hit. A social roleplay game and a round-based obstacle game can also have different session patterns even at the same CCU. The goal is a defensible peer comparison, not a universal ranking.
Full guide
Choose peers before looking at the winner
Start with age, scale, and genre. Age controls for the time available to accumulate Visits, favorites, votes, and content. Scale reduces the distortion between games at very different distribution stages. Genre supplies behavioral context: session structure, social play, repeat frequency, and monetization opportunities vary. If there are too few exact peers, widen one condition and lower confidence instead of silently mixing everything.
Roblox’s owner analytics may use games with similar players, genre benchmarks, or all-experience benchmarks depending on available data. The comparison set can change as Roblox learns more and similar-game benchmarks update daily. Record which set and date you used. Benchmarks are a diagnostic reference; Roblox explicitly says benchmark games do not affect Recommended for You ranking.
- Define the decision and the metric that represents it.
- Filter to a similar observed age or clearly state when launch age is unknown.
- Use a comparable Visits or CCU band to avoid mixing distribution stages.
- Keep genre or player pattern similar; widen only when the sample is too small.
- Require the same time window, observation freshness, and minimum coverage.
- Show the peer count, percentile or range, and every relaxation made.
Match the metric to the question
For present audience, compare 24-hour mean CCU rather than snapshots taken at different local times. For direction, compare equal-window CCU growth and seven-day log trends. For recent traffic volume, compare Visits deltas rather than lifetime totals. For public interest density, ratios such as mean CCU per 100,000 Visits can be helpful, but they are not retention or conversion.
Ratings need sample size. A 100% rating from ten votes is less certain than a 94% rating from thousands. Use vote counts or a conservative interval such as a Wilson lower bound when ranking. Favorites and vote gains can support a pattern, but counters may be delayed or reversed and do not identify unique users. For owner data, compare D1/D7 retention, session time, payer conversion, and ARPPU against the matching Roblox benchmark.
| Bad comparison | Fairer replacement | Reason |
|---|---|---|
| Current CCU at unrelated times | 24-hour time-weighted mean | Controls the daily cycle |
| Lifetime Visits across ages | Visits delta in the same window | Measures recent flow |
| Rating percent alone | Rating plus vote base or confidence bound | Accounts for uncertainty |
| All genres in one rank | Age-, scale-, and genre-matched peers | Adds behavioral context |
Illustrative peer comparison
Illustrative example: Game A has 400 mean CCU and one million Visits; Game B has 700 mean CCU and fifty million Visits. B is larger now, but that fact alone does not mean it has stronger momentum or interest density. If A is three weeks old and B is four years old, compare each with age- and scale-matched peers, then examine growth and Visits deltas. The honest result may be “B has more activity; A ranks higher within its early-stage cohort.”
Do not collapse several metrics into an unexplained score. If MARPLA shows a composite public score, read its methodology, available groups, confidence, and penalties. It ranks investigation priority from public evidence; it is not a probability of success, valuation, or substitute for private analytics. Preserve the individual metrics so a reader can disagree with weights and still inspect the evidence.
Publish the limitations with the result
A public comparison cannot see acquisition sources, unique daily users, cohort retention, playtime, revenue, costs, or experiment allocation. It can also be left-censored: a game already active when monitoring began has an unknown true launch baseline. Creation date is the Universe creation date, not necessarily public release. Missing snapshots can bias windows, and an updated timestamp does not describe the magnitude of a release.
A useful comparison report therefore includes the as-of time, coverage, formulas, peer rules, sample size, missing fields, and a plain-language conclusion. Prefer statements such as “higher observed seven-day CCU growth among 18 matched games” over “the fastest-growing simulator.” The first is testable; the second silently claims a complete market and a stable future.
Primary sources
Put this into practice in MARPLA
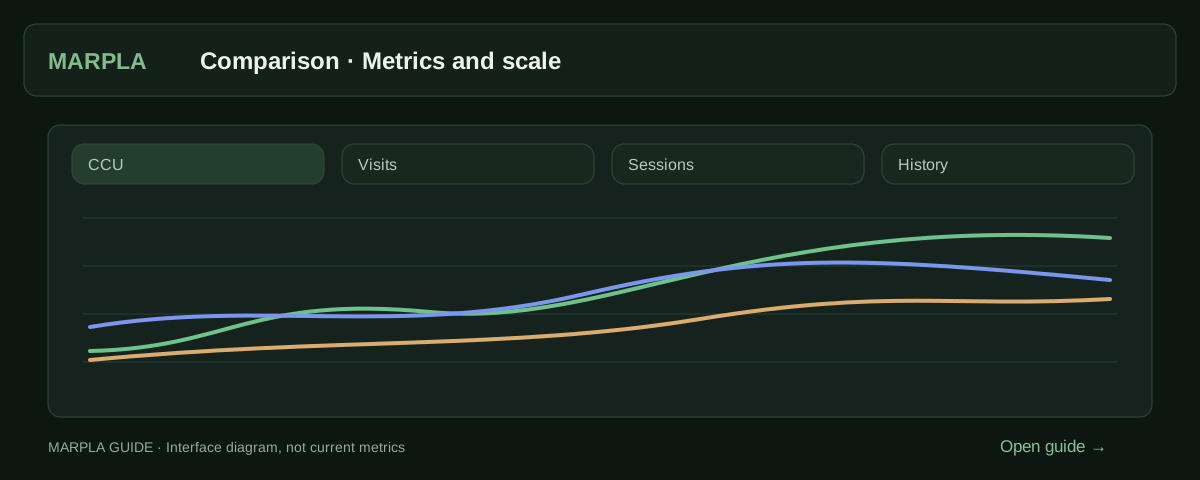
Add comparable games to Comparison and select a common period. Check observation coverage and distinguish public session estimates from private owner metrics.
- Compare gamesCompare how several projects perform over the same period.Step-by-step guide →
- Start analyzing a gamePublic analysis helps you explore a game's audience, activity and rating.Step-by-step guide →
Continue exploring
More on this topic →
CCU, Visits, and growth: what the numbers actually say
Understand Roblox audience metrics without confusing a live snapshot, a lifetime counter, and a measured trend.
Read article
How to spot sustainable Roblox growth instead of a temporary spike
Use several time windows, supporting counters, and peak preservation to distinguish a rising baseline from a short burst.
Read article
How to analyze a Roblox game before investing time or money
A repeatable due-diligence workflow that separates public evidence, owner-only analytics, hypotheses, and unanswered questions.
Read article
Discussion0
Loading comments…