
Data & methodology
CCU, Visits, and growth: what the numbers actually say
CCU, Visits, and growth answer different questions. CCU is simultaneous activity at a moment. Visits is a cumulative counter of entries and includes repeat visits. Growth is not a field Roblox hands you: it is a comparison built from observations over defined windows. Combining them can reveal useful patterns, but none of them alone equals DAU, unique players, retention, revenue, or future demand.
Full guide
Separate the three measurements
Current CCU tells you how many players are concurrently in the game when the source is read. It can change quickly with time of day, school schedules, weekends, events, ads, outages, and recommendation exposure. A single CCU number is therefore a snapshot. Use repeated observations to calculate a time-weighted mean, a range, and a peak for a stated period.
Visits is cumulative and is not a count of unique people. The same player can contribute multiple visits. The lifetime total is useful for scale and normalization, but it mixes every phase of the game’s history. To examine current acquisition volume, use the difference between valid Visits snapshots at the boundaries of a period. Growth compares like with like: for example, mean CCU in the latest 24 hours divided by mean CCU in the previous 24 hours, minus one.
| Metric | Answers | Does not answer |
|---|---|---|
| Current CCU | How many are playing at this observation | How many unique users played today |
| Lifetime Visits | How many total entries Roblox reports | Current momentum or unique audience |
| Visits delta | How much the cumulative counter changed | Exact acquisition source or retention |
| CCU growth | How observed activity changed between equal windows | Cause or future trajectory |
Read the time series before the headline
First verify coverage. If a collector missed hours, the apparent minimum, peak, or mean may be biased. MARPLA weights CCU by observed duration, because ten minutes at one level should not count the same as twenty minutes at another. Use an observation timestamp and coverage note whenever you quote a result. A stale source is historical evidence, not the current online population.
Second, check multiple windows. One-hour movement is responsive but noisy. Twenty-four hours includes a daily cycle. Seven days includes weekdays and a weekend, making it better for baseline direction. Compare each period with the immediately preceding equal period. When the prior mean is near zero, a percentage can explode; show the absolute values and mark a small baseline instead of leading with the percentage.
- Check the observation time and data coverage.
- Read current CCU beside the 24-hour mean, minimum, and maximum.
- Compare equal current and previous windows for 1 hour, 24 hours, and 7 days.
- Read Visits delta and social-counter changes over the same boundaries.
- Show absolute values whenever a percentage starts from a small baseline.
- Wait for the window to mature before declaring a sustained change.
Use derived signals with their limits attached
CCU per 100,000 Visits normalizes present activity by historical scale. It can help compare interest density, but it is not retention: the numerator is current activity and the denominator is a lifetime counter. A young game and an old game can still be structurally different after normalization. Likewise, favorites or positive votes per 1,000 new Visits are public counter ratios, not unique-user conversion rates.
An estimated session length can be approximated from mean CCU multiplied by minutes in the period and divided by new Visits. MARPLA only treats this as an estimate when there are enough new Visits and sufficient observation coverage. It can be distorted by retries, teleports, counter timing, and missing samples. Owner analytics supplies the actual session-time metric and should replace the estimate whenever authorized data exists.
Illustrative reading
Illustrative example: a game shows 600 CCU now, a 24-hour mean of 300, and a seven-day mean of 280. The current value is a strong moment, but it is too early to call the baseline 600. If the next full day averages 430, Visits also accelerate, and activity remains elevated across different hours, the evidence for growth becomes stronger. If CCU returns to 280 after two hours, describe it as a spike.
Avoid multiplying current CCU by 24 to invent DAU, dividing lifetime Visits by game age to claim current demand, or reading a positive percentage as a forecast. Roblox defines DAU as unique players who joined at least once in a day and session time as playtime divided by sessions; those are owner analytics, not transformations of one public snapshot.
Primary sources
Put this into practice in MARPLA
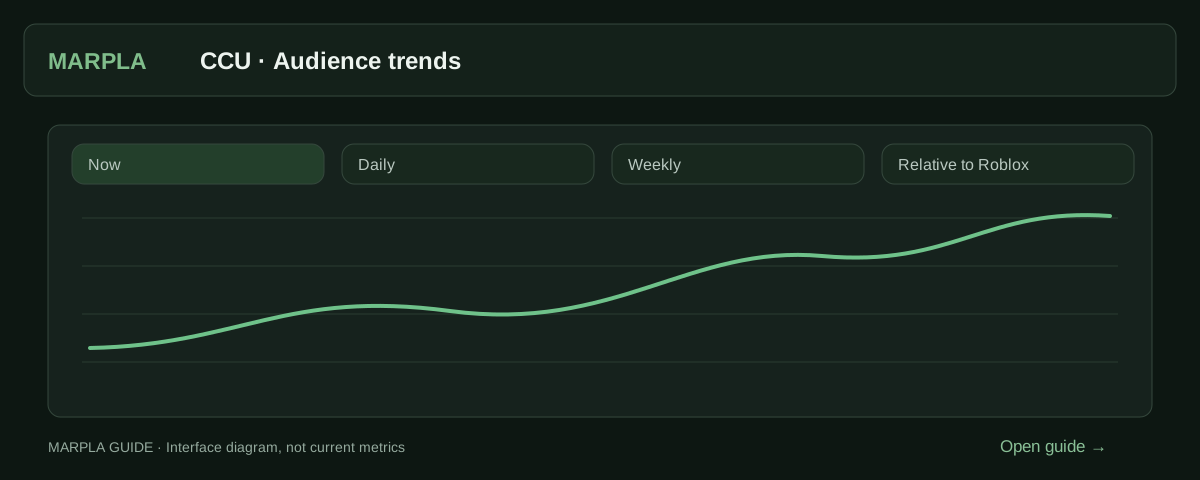
Open a game card and compare CCU over matching periods. Check changes against Roblox-wide concurrency before interpreting a spike as sustained growth.
- Set up a chartThe range sets how much time to show; the interval sets how points are grouped.Step-by-step guide →
- Understand game growthCompare changes in a game's audience with changes in Roblox's overall player count.Step-by-step guide →
Continue exploring
More on this topic →
Public Roblox data vs owner analytics
Know what can be observed from the market, what requires permission, and where public estimates must stop.
Read article
How to analyze a Roblox game before investing time or money
A repeatable due-diligence workflow that separates public evidence, owner-only analytics, hypotheses, and unanswered questions.
Read article
How to spot sustainable Roblox growth instead of a temporary spike
Use several time windows, supporting counters, and peak preservation to distinguish a rising baseline from a short burst.
Read article
Discussion0
Loading comments…