
Growth & updates
How to spot sustainable Roblox growth instead of a temporary spike
A chart that rises sharply is an alert to investigate, not proof of durable growth. Roblox activity moves with the daily cycle, weekends, holidays, ads, events, creator videos, recommendation exploration, and platform-wide changes. Sustainable growth appears when a game establishes a higher baseline across time and independent signals. The practical task is to watch what remains after the attention burst, while stating clearly that public observations do not reveal the cause.
Full guide
Read the shape across three horizons
Use one hour to detect movement, 24 hours to capture the daily cycle, and seven days to include weekdays and a weekend. Compare the time-weighted mean in each window with the immediately previous equal window. Then inspect the raw line: a smooth climb, repeated higher lows, and activity across several time zones are different from one narrow peak followed by a full return to baseline.
A logarithmic seven-day trend is useful because equal proportional changes receive comparable weight, but it remains a description of the observed past. Check coverage before using any slope, mean, minimum, or peak. A missing overnight interval can make a game appear steadier or stronger than it was. A very small baseline can also create spectacular percentages, so always show starting and ending levels.
| Pattern | Evidence to seek | Safe conclusion |
|---|---|---|
| Short spike | Sharp peak, rapid return, little supporting movement | A burst occurred |
| Higher baseline | Higher means and higher lows across a full daily cycle | Observed activity shifted upward |
| Sustained growth | Positive 24h and 7d direction plus Visits and social gains | Several public signals strengthened |
| Unclear | Sparse coverage or immature window | More observation is required |
Require confirmation beyond CCU
Check whether cumulative Visits gained faster during the same period. Then look for new favorites and positive votes, while remembering that these counters are not unique-user conversions and votes can be withdrawn. Agreement does not prove player satisfaction, but it reduces the chance that you are reacting to one noisy measurement. Disagreement is useful: rising CCU without Visits movement may point to counter timing or data quality that needs investigation.
Measure peak preservation only after the window has finished. Compare average CCU 24–48 hours, 72–96 hours, and seven to eight days after the observed peak with the peak itself. The later ratios reveal how much of the burst remained. They do not reveal whether ads, an influencer, an event, a content release, or Roblox’s recommendation exploration created it.
- Confirm a fresh series with enough samples across the full daily cycle.
- Compare current and previous equal windows for 1 hour, 24 hours, and 7 days.
- Show absolute means beside every percentage, especially when the baseline is small.
- Check Visits, favorites, and vote changes over matching boundaries.
- Wait for 48-hour and seven-day peak-preservation windows to mature.
- Check reported updates, events, and known campaigns as possible explanations, not proven causes.
- Set a revisit date instead of converting early momentum into a forecast.
Account for recommendation exploration and traffic mix
Roblox describes an explore-and-expand process for Home recommendations. An experience may receive a temporary influx while the system learns which users respond well; distribution can then settle at a new baseline or fall back. Roblox also notes seasonality and competition from other games. These factors mean that a CCU change can occur without a release by the developer.
Owners can inspect acquisition by source and Home recommendation signals. Public observers cannot. When owner data is available, separate Home recommendations, search, sponsored ads, friends, teleports, and other sources, then compare the engagement and retention of acquired cohorts. A paid burst with weak return behavior has a different meaning from organic distribution that holds after spend ends.
Illustrative classification
Illustrative example: a game rises from a 24-hour mean of 120 CCU to 360, peaks at 900, and falls to a mean of 150 during the following two days. Visits jump during the peak but later return to their earlier pace. The supported conclusion is “a large burst occurred, with limited preservation above the prior baseline.” Calling it a breakout would be premature.
Now suppose the next week averages 310 CCU, daily lows remain above 220, Visits continue to accelerate, and favorites and votes rise. That is stronger evidence of sustained public activity. Still avoid “the game will keep growing” or “the update worked.” Growth can reverse, and causality needs owner-side source data or a controlled experiment. Use the signal to prioritize deeper review.
Primary sources
Put this into practice in MARPLA
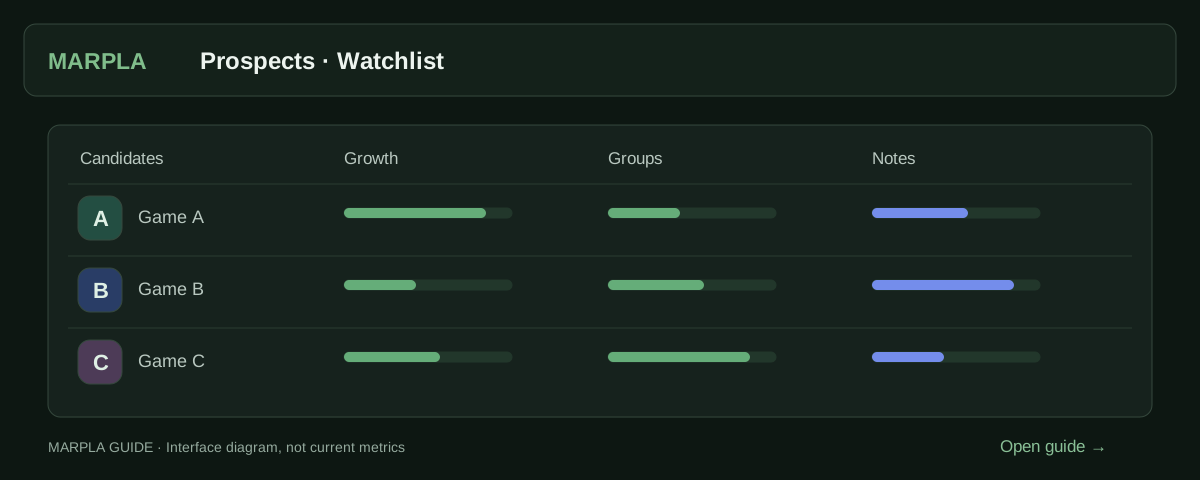
Shortlist prospects, save them in a group and record dated observations. Revisit their history to distinguish sustained movement from an isolated spike.
- Choose a promising gameThe radar helps you shortlist games to watch and discuss with your team.Step-by-step guide →
- Favorite groups and note historyOrganize games in private groups and record observations by day.Step-by-step guide →
Continue exploring
More on this topic →
How to evaluate a Roblox update without claiming false causality
Plan the measurement, align cohorts and windows, inspect confounders, and reserve causal language for controlled experiments.
Read article
CCU, Visits, and growth: what the numbers actually say
Understand Roblox audience metrics without confusing a live snapshot, a lifetime counter, and a measured trend.
Read article
How to compare Roblox games fairly
Build a peer set, align time windows, normalize scale, and keep public comparisons within what the data supports.
Read article
Discussion0
Loading comments…