
Growth & updates
CCU spike or sustained growth: a practical classification
A high point can be valuable without being durable. Classify the observed shape before telling a story about its cause. This workflow expands [how to spot growing games](/en/resources/spot-growing-games) and turns a public alert into a testable monitoring plan.
Focused deep dive
Five shapes and the evidence they need
A one-off spike rises and falls within a short window. A daily cycle repeats at similar local hours. A step-change moves to a higher baseline and remains there through comparable cycles. A gradual climb improves across several matched windows. A rebound recovers from an unusually low base. Each shape can be useful, but only step-changes and climbs support a sustained-growth label after enough time and coverage.
Use absolute CCU, percentage change, and coverage together. Then seek independent confirmation: Visits increments, favorites, votes, chart appearances, update timing, or public community activity. For an owned game, inspect acquisition source, new-user cohorts, retention, session time, and monetization. Public data cannot prove that growth is organic or profitable.
Worked example: event spike versus new baseline
A game normally ranges from 80 to 140 CCU. At 19:00 it reaches 600 after a creator stream, falls to 160 by 22:00, and returns to 110 the next day. That is a meaningful promotional spike but not sustained growth. A second game normally ranges from 80 to 140, rises to 220 after an update, and stays between 180 and 260 through three matched daily peaks while Visits and favorites continue to increase.
The second pattern supports “higher observed baseline after the update,” not yet “the update caused growth.” Advertising, Home distribution, a holiday, or another external event may overlap. The next step is different: monitor the first game for conversion after the stream; for the second, request owner cohort and acquisition data or run a controlled experiment.
Classify, confirm, then decide
Define in advance how long and across which cycles a new level must persist for your decision.
- Mark the prior baseline and the first unusual point.
- Check for gaps and compare matched daily or weekly windows.
- Label the shape without naming a cause.
- Seek one independent public signal and a direct play-test.
- Set a review date, success rule, and removal rule.
Stories that outrun the evidence
A percentage from a tiny base can look dramatic. One large influencer event can inflate CCU without improving return behavior. A missing trough can make a spike look like a plateau. Platform-wide traffic and regional schedules can move many games together. Check the absolute base, other games, and the platform context.
Do not call a curve organic, viral, retained, or profitable from public CCU alone. “Observed growth persisted for three matched daily cycles” is a defensible statement. “The update fixed retention” requires authorized retention evidence or a suitable experiment.
Decision record
Save the baseline, first anomaly, classification, supporting signals, confounders, persistence rule, and next review time. If the shape changes from spike to a higher baseline, append the evidence that justified reclassification.
Primary sources
Put this into practice in MARPLA
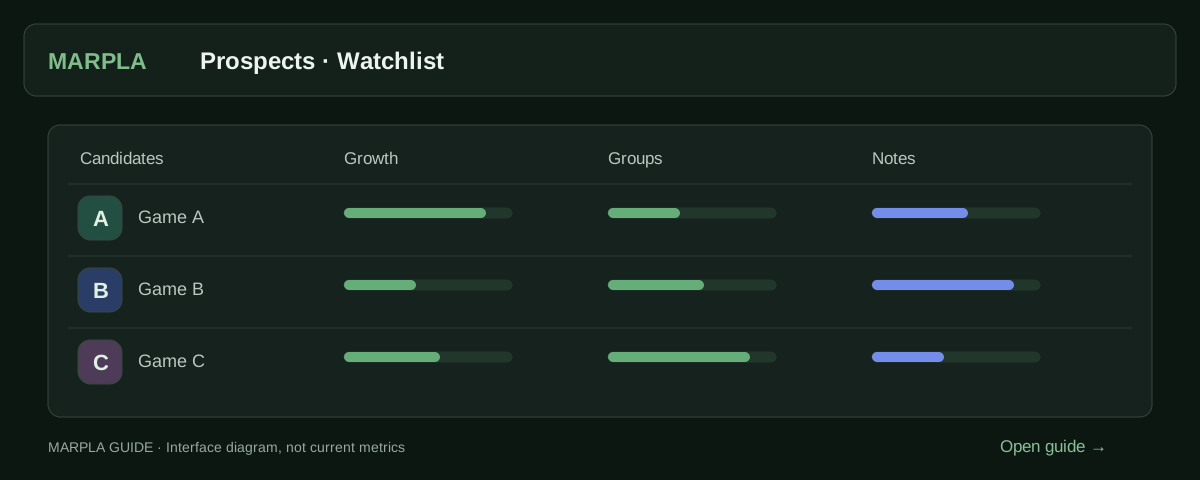
Shortlist prospects, save them in a group and record dated observations. Revisit their history to distinguish sustained movement from an isolated spike.
- Choose a promising gameThe radar helps you shortlist games to watch and discuss with your team.Step-by-step guide →
- Favorite groups and note historyOrganize games in private groups and record observations by day.Step-by-step guide →
Where this deep dive applies
Continue exploring
More on this topic →
How to spot sustainable Roblox growth instead of a temporary spike
Use several time windows, supporting counters, and peak preservation to distinguish a rising baseline from a short burst.
Read article
How to find growing Roblox games: signals and a candidate card
Shortlist growing Roblox games using CCU trends, history, and data coverage. Includes a candidate card, repeat checks, and limits of public analytics.
Read article
How to evaluate a Roblox update without claiming false causality
Plan the measurement, align cohorts and windows, inspect confounders, and reserve causal language for controlled experiments.
Read article
Discussion0
Loading comments…