
Data & methodology
MARPLA CCU history essentials
The CCU chart is a history of points MARPLA actually observed. The collector has scheduled opportunities, but a five-minute bucket is a target for parts of the system, not a promise that every game receives a point every five minutes. Rotation, request limits, rate limiting, partial upstream responses, and new discoveries can leave gaps.
Action essentials
Treat missingness as part of the evidence
Check the latest timestamp, interval spacing, and coverage before using a peak, trough, or percentage change. Do not interpolate a long gap and present it as observed behavior. Compare games over the intersection of their covered windows, or clearly label unequal coverage.
CCU measures concurrency at each snapshot. Its area over time can support a cautious public session estimate when paired with Visits increments, but the result remains derived and can be distorted by delayed counters. It does not turn into DAU, retention, or revenue. Use authorized owner analytics when the decision requires those measures.
When the line is sparse, the correct next step is another observation or a wider supported window, not a smoother curve drawn from assumptions.
- Confirm the last observed time.
- Mark gaps and exclude unsupported intervals.
- Compare matching covered windows.
- Carry the limitation into the final decision note.
Primary sources
Put this into practice in MARPLA
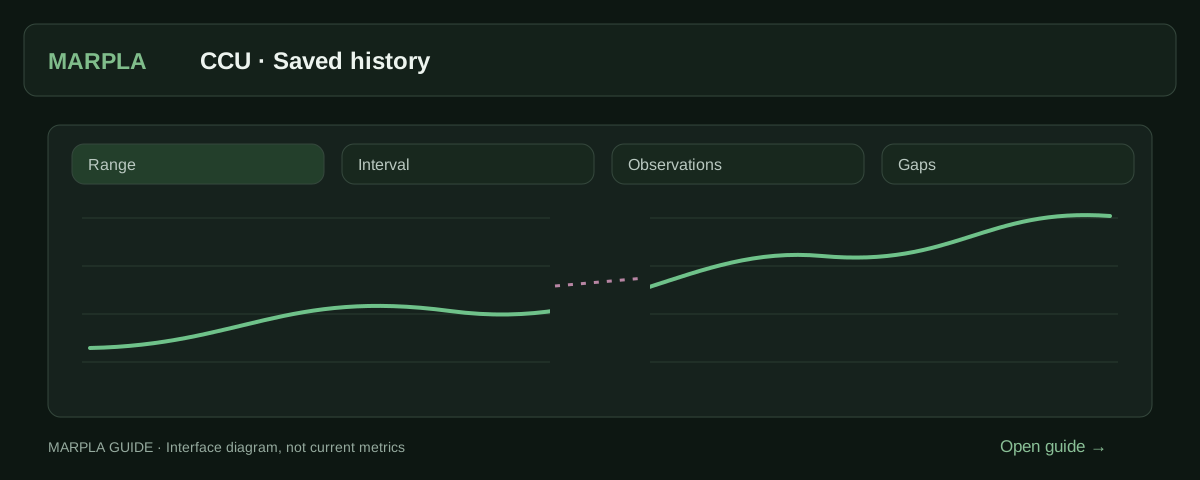
Open CCU history and set its range and interval. Check observation dates and gaps before concluding that the game declined or an update had an effect.
- Set up a chartThe range sets how much time to show; the interval sets how points are grouped.Step-by-step guide →
- Follow game updatesMonitoring builds project history for later comparisons.Step-by-step guide →
Where this deep dive applies
Continue exploring
More on this topic →
Observed CCU history for Roblox games
Inspect saved concurrent-player samples with honest gaps, timestamps and range controls.
Read article
Estimating session length from public CCU and Visits
The logic, assumptions, confidence labels, and failure modes behind MARPLA’s public session estimate.
Read article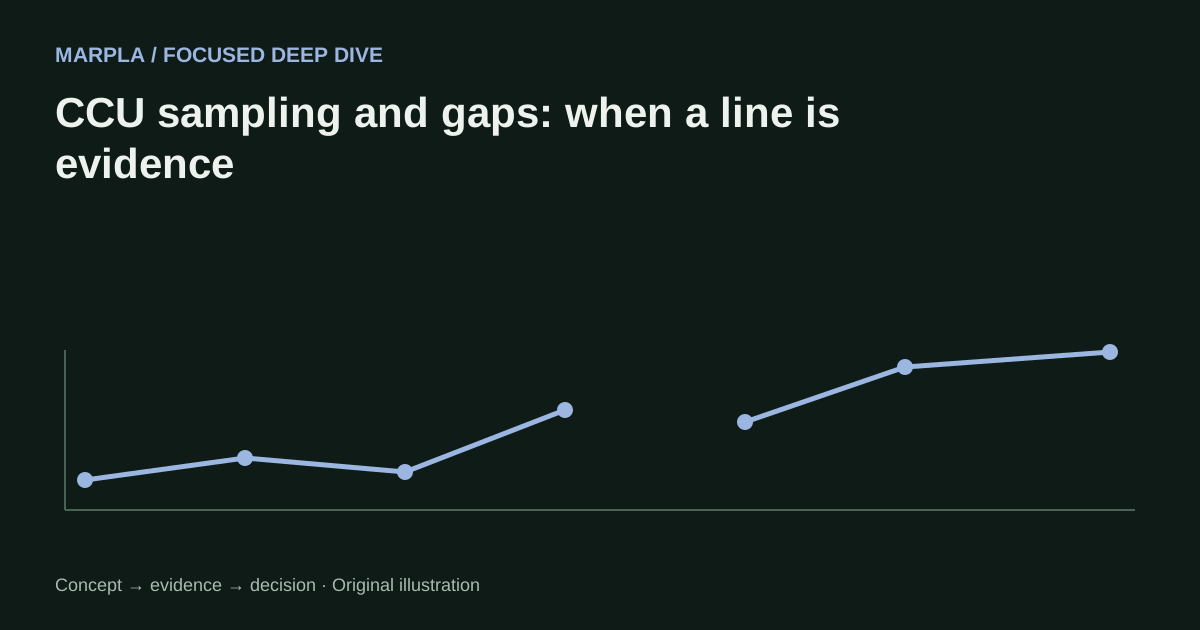
CCU sampling and gaps: when a line is evidence
How to read sampled Roblox CCU history, assess coverage, and avoid manufacturing behavior between missing points.
Read article
Discussion0
Loading comments…