Charts & data
Ranges, intervals, breakdowns, tooltips and Roblox comparisons.
Quick start
- 1Choose a range. The whole range fits the chart width without scrolling by default; usually 30 days are selected. Game panels open nearly full screen, or full screen on a phone.
- 2Choose the interval and breakdown in the chart's own toolbar. No duplicate breakdown charts or selector buttons are created; the list contains only dimensions supported by the source.
- 3Hover a point or tap the chart. The tooltip appears above the pointer without covering the selected point. Keyboard: arrow keys and Home/End; Escape dismisses the tooltip.
When data is missing
- Reason in the cell
- Empty cells and related breakdowns show the known state: no API key, authorization rejected (401), permission access denied (403), rate limiting (429), temporary service failure, or history not yet loaded. Another metric's error is not attributed to this breakdown. A real zero is displayed as 0.
- Playing now
- The badge uses one consistent name. If its saved count is older than 15 minutes, the dot turns yellow without an extra status line; hover for the exact observation time. An old count is not presented as a fresh measurement.
- Chart sync
- The same icon-only sync button sits at the bottom right of every chart. It refreshes that chart's own source without reloading the page and preserves the range, interval and breakdown. The icon spins during the request and repeat clicks are disabled.
- Add / replace API key
- If no key is connected, use Add API key. A confirmed Roblox authorization or permission error (401/403) offers Replace API key and opens the selected game's protected setup form. An empty response alone is not a key error. These actions require integration-management access; otherwise ask the game owner.
- Cooldowns & data delays
- After a Roblox rate limit (429), retry is disabled until the cooldown ends. Network failures do not require a new key. Stored points are preserved and gaps are not replaced with zeros. Metrics that have not matured yet, such as D30 for a young game, require waiting for report data.
Chart tools
- Auto / interval
- Auto chooses an interval from available history. Hour views use five-minute observations where available. A daily metric cannot become minute-level data.
- Breakdown
- Splits the current chart into lines by acquisition source, country, platform and other supported dimensions. The selector is inside the chart; a separate chart for the same metric is unnecessary. See the breakdown dictionary below.
- Line / smooth / bars
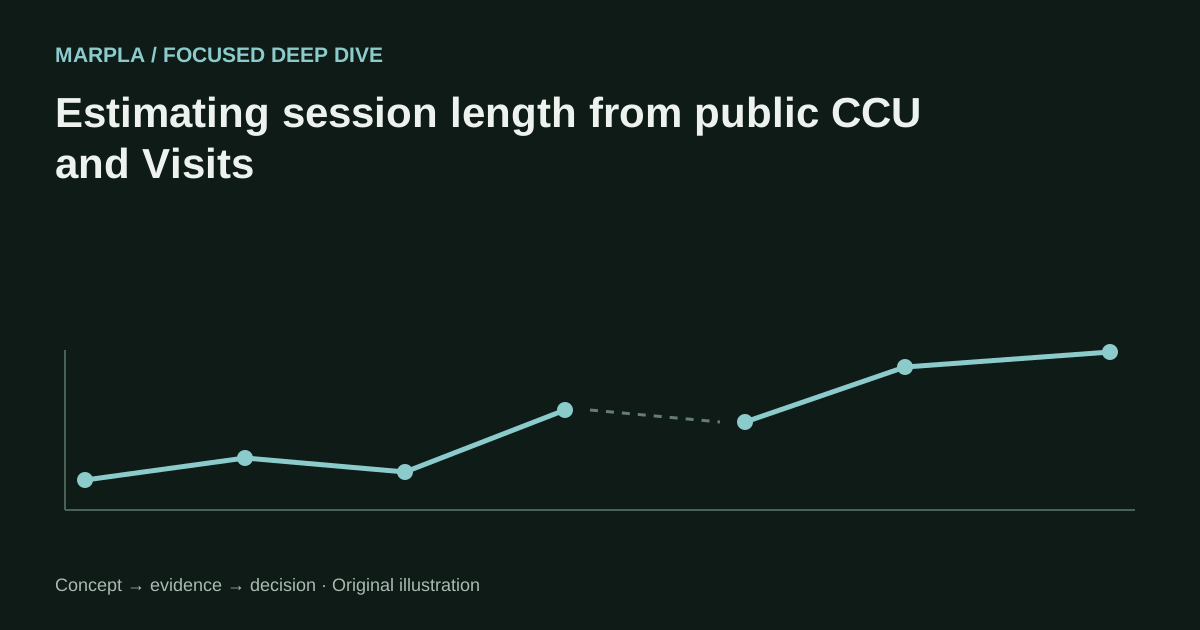
- Change presentation only. Smoothing adds no measurements. A line may connect known points across a gap, but there are no measurements inside that gap.
- Legend
- Click to hide or restore a line; double-click to isolate it. Different sources and segments are never merged.
- Full range fitted to width
- The full selected range always fits the chart width. Date labels and vertical guides adapt automatically to screen width, while exact timestamps for every observation remain available in tooltips. The chart keeps only its useful display controls and the standard sync button at the bottom right.
History, gaps & performance
Pages read stored MARPLA data. Collection and retries extend the archive when sources supply new values. Current CCU cannot reconstruct history before observations began. Missing values are not filled with zeros. Market history is limited to 2,000 intervals per request; long charts also reduce rendered points while preserving endpoints and extrema. Narrow the range for detail. Tooltips show timestamps and time zones.
Popularity relative to Roblox
Only shared completed hours are compared. Game CCU is the mean of five-minute snapshots with at least 75% coverage; platform CCU is the chosen source's hourly estimate. Daily peaks are not used. The chart shows percentage change from the first shared point of the selected range, starting at 0%. Share change = 100 × ((game CCU / platform CCU) / initial ratio − 1). Auto selects hour, day, week or month. Larger intervals keep the last real matched point per bucket, not an invented average index. If the game grows 20% and Roblox grows 10%, relative growth is about 9.09%. This measures share in an external index, not proven advertising or update impact. The ? icon on each result opens its concise definition, so the interface does not repeat a long explanation under the cards. RobloxCCU / RoTrends and RoWatcher use different methods, not an official census of every player.
- Selected-range calculation
- The range ends at the last completed UTC hour. A point is labelled by the hour's end: 1h compares two adjacent completed hourly means, while 30d compares the means at the start and end of a 30-day window. Changing range recalculates the baseline and all three changes. If shared boundary data is missing, the result uses the available matched observations. The entire requested range stays on the axis; no line is invented beyond observations. All time starts at the first shared point.
- One chart heading
- The card keeps one large heading with help, range and interval controls, three result cards and the chart itself. It does not duplicate a source label, partial-range row, latest-interval row or a second internal chart title.
Manual platform-activity sync
The square sync button on total Roblox activity and game-versus-platform charts starts a real background collection only for a signed-in user. Server leases still apply: live activity and RoWatcher are requested at most every 5 minutes, while the daily RobloxCCU archive is requested at most once a day. Another click inside that window returns stored points without creating an extra upstream request. For a guest, the same button truthfully reloads only the already stored chart.
Breakdown dictionary
- No breakdown
- Total audience with one line.
- Age group
- Roblox age groups.
- Platform
- Computer, phone, tablet, console and VR.
- Operating system
- Android, iOS, Windows, macOS and other OSes.
- Gender
- Available Roblox gender categories.
- Main countries
- Countries with the largest audience.
- Main languages
- Languages with the largest audience.
- New and returning
- New players and already familiar with the game.
- Acquisition source
- Home, Search, Sponsored Ads and other sources.
- Product
- Individual developer products, passes, and other Roblox products.
- Type of product
- Developer product, pass, subscription, and other product types.
- Place of sale
- The location inside the experience where the purchase was made.
- Product SKU
- Products reported by the experience in AnalyticsService events.