Compare audience composition and quality
Compare a complete period with its predecessor and separate audience mix change from within-segment metric change.
How to use it
- Open My games, choose a game, and select the Audience quality button among the analytics sections. The sidebar stays visible.
- Choose an audience filter and value, then a breakdown and metric: for example, Gender → Women → Devices → D1. It becomes the first chart. Each chart has its own period, defaulting to 30 days or the shorter available history. Tables compare the latest 30 complete days with the preceding 30 days.
- Check data availability. On country charts, select All, a top-10 country or one of Other countries: all lines start disabled and your selection is saved. Gaps, immature cohorts and metrics without the correct denominator are not compared.
- Search, sort, or pin segments and export CSV when needed. Treat the decomposition as descriptive and the advertising hint only as a plan for the next test.
Advice and practical context
Check which comparisons are actually available first
Choose a range and inspect the availability matrix before reading the ranking. It separates source support from rows that MARPLA has actually recorded. When a metric and dimension combination is absent, the screen does not infer it from adjacent data. An empty day remains a gap. Wait for retention cohorts to mature, and require the correct denominator on the same dates and segments before using weighted quality. History starts with MARPLA's first observation and increasing the collection budget does not reconstruct earlier days.
A decision example without false causality
Example: across the latest 14 complete UTC days, the mobile segment's share rises and the overall metric falls, while quality within each observed segment is nearly unchanged. The decomposition describes the contribution from composition; it does not prove that device caused the decline. Check gaps, volume, and equal maturity in both periods first. Then pin useful rows, export CSV, and define one follow-up test. An advertising mapping identifies a possible targeting field but does not prove account availability or change a campaign. Without cost and observed source-level monetization, no segment can be called profitable.
A new country and blended averages
During Home expansion, separate audience composition from within-segment quality. Check source, equal cohort maturity, country and an available device breakdown. D1 cannot be weighted using DAU. New organic RFY traffic contributes to Home signals, so not every decline is harmless. Investigate translation, loading and the first step; relate dates to Home history and notes. Useful articles provides a detailed guide and examples.
Technical detailsCalculations, permissions and behavior
Audience quality
Open My games, choose a game, and select the Audience quality button beside the other analytics sections. The view stays inside MARPLA with the sidebar and game-section navigation. The screen uses only saved OneDay rows.
Each chart has its own period: 1, 3, 7, 14 or 30 days, 6 months, a year or all time in UTC. Tables compare the latest 30 complete days with the preceding 30 days. The current incomplete UTC day is excluded.
History contains only observations actually received. Requesting a selected slice queues available history for the latest 60 days; Roblox determines readiness and returned depth. The availability matrix distinguishes dimensions and metrics supported by the source from combinations that have actually been observed; unsupported slices are never inferred.
A gap remains missing, never zero. Separate charts show daily segment volume and quality. Every country chart, including jointly observed breakdowns, follows the demographics layout: All, the top 10, and a collapsed Other countries group, with all lines initially disabled.
Selection is saved per game, metric and chart. Standard range, step, display style, milestone and refresh controls are available; unsupported source intervals are disabled. This section supports daily steps.
Chart refresh rereads saved data; the top Refresh data button requests the selected slice from Roblox. All time starts at the first available saved record; exceeding the processing limit shows an error asking for a shorter period, without truncating the data. The table supports search, sorting, personal pins, and CSV; period volume is a sum of daily values, not unique players across the whole period.
Acquisition-source users can overlap across rows, so their shares need not total 100%. Quality is aggregated with the metric's correct denominator; without that denominator, a jointly observed breakdown, or a mature cohort, the value is not replaced by a simple average. The comparison symmetrically decomposes the overall change into composition change and within-segment metric change; this is descriptive, not causal evidence.
Ranking excludes advertising cost and remains provisional when launch, engagement, retention, or monetization blocks are missing; absent source-level monetization cannot support a claim that one source pays back better. An advertising-field hint only maps an observed dimension to a possible targeting control: it does not prove that control is available to the account or authorize MARPLA to change campaigns. Gender line colors are fixed: men are blue, women pink, unknown green, and All yellow.
Colors stay the same when changing the period, ordering or visibility, including combined breakdowns.
Audience filter and joint breakdown
In Audience quality choose four fields: Audience filter → Gender, Value → Women, Breakdown → Devices, Metric → D1. Lines show women's retention separately on phones, tablets, computers and other devices actually returned by Roblox. All refers to the selected audience, not every player in the experience.
Country, age, OS, language, acquisition source and behavioral segments also come from the Roblox catalog. Dropdown values come from the game's saved observations; numeric gender codes are never guessed. Unsupported metric/dimension choices are not presented as working.
Available metrics include D1/D7/D30, DAU, visits, playtime, launch and payer conversion, revenue and other supported measures, subject to your permissions. For Home, choose the acquisition-source filter and its actual saved Home value, then gender, device or another supported breakdown. Special Home signals do not receive dimensions absent from their source.
One filter and one breakdown use an actual two-dimension query. Separate gender and device series cannot stand in for their intersection. New slices request real joint data; Refresh data retries through the shared connection and preserves history.
Source restrictions, delays and missing joint rows are reported without invented values. D1/D7/D30 are never averaged across devices without the original cohort counts. Each slice and chart retains independent periods, steps, milestones and line selections; the default is 30 days, with the chart start bounded by available history.
Chart order and independent periods
In Audience quality, the top fields select a dimension and metric. That metric is always first: Gender and D1 show D1 retention by gender. Audience volume, fixed composition and shares follow.
Every chart has its own period and calendar day, defaulting to 30 days or the shorter available history. Changing one chart does not change its neighbors. Tables and ranking remain based on the last 30 complete UTC days, as stated in their headings.
These calculated charts support daily intervals: weekly conversion averages are not fabricated without the correct denominator. Choose milestone types, lines and display style on the chart itself. Audience composition columns retain only fully reconciled shares; incomplete days are not normalized to 100%.
Country and Home breakdown capabilities
Country, Gender, Platform, AgeGroupV2 and OperatingSystem support active audience, playtime, retention and monetization metrics. Country × device requires a separate joint observation; two independent breakdowns do not reveal their intersection. Platform means computer, phone, tablet, console or VR; OS is separate.
A multi-device user may appear more than once. Core Home recommendation coefficients support gender and age; these RFY metrics do not support country, platform or OS. AcquisitionSource impressions and plays may have a joint slice with gender, age, platform or OS when that exact observation has been collected; country is unsupported.
Detailed Home signals—early quits, play days, playtime, coplay, qualified sessions, spend days and Robux spent—arrive through the helper as daily series without demographic breakdowns. Thumbnail-set breakdowns use ThumbnailAsset + ThumbnailList, not country or gender. Compare Home with D1, playtime and revenue in Multi chart, adding creative-change and update milestones.
Useful articles: examples and decisions
The guide covers the steps in the service. These articles explain the metrics, examples, techniques and how to evaluate results.
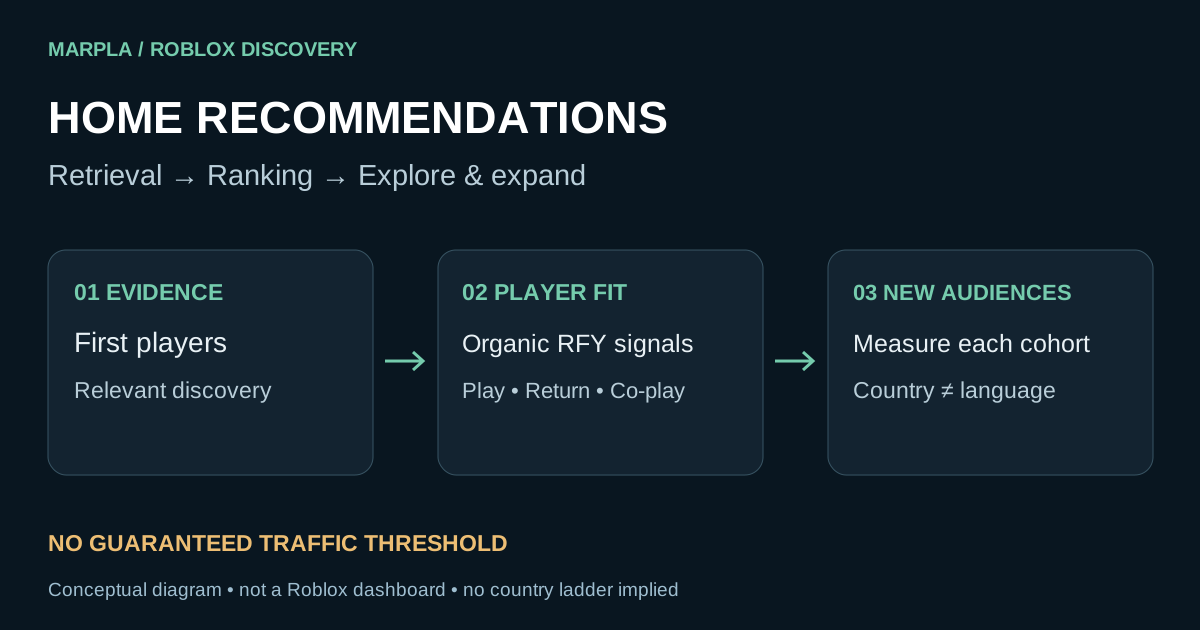
Roblox Home recommendations: get discovered and sustain growth
How Roblox tests and expands Home recommendations, what signals matter, and how to diagnose country mix and falling metrics with MARPLA.
Read article →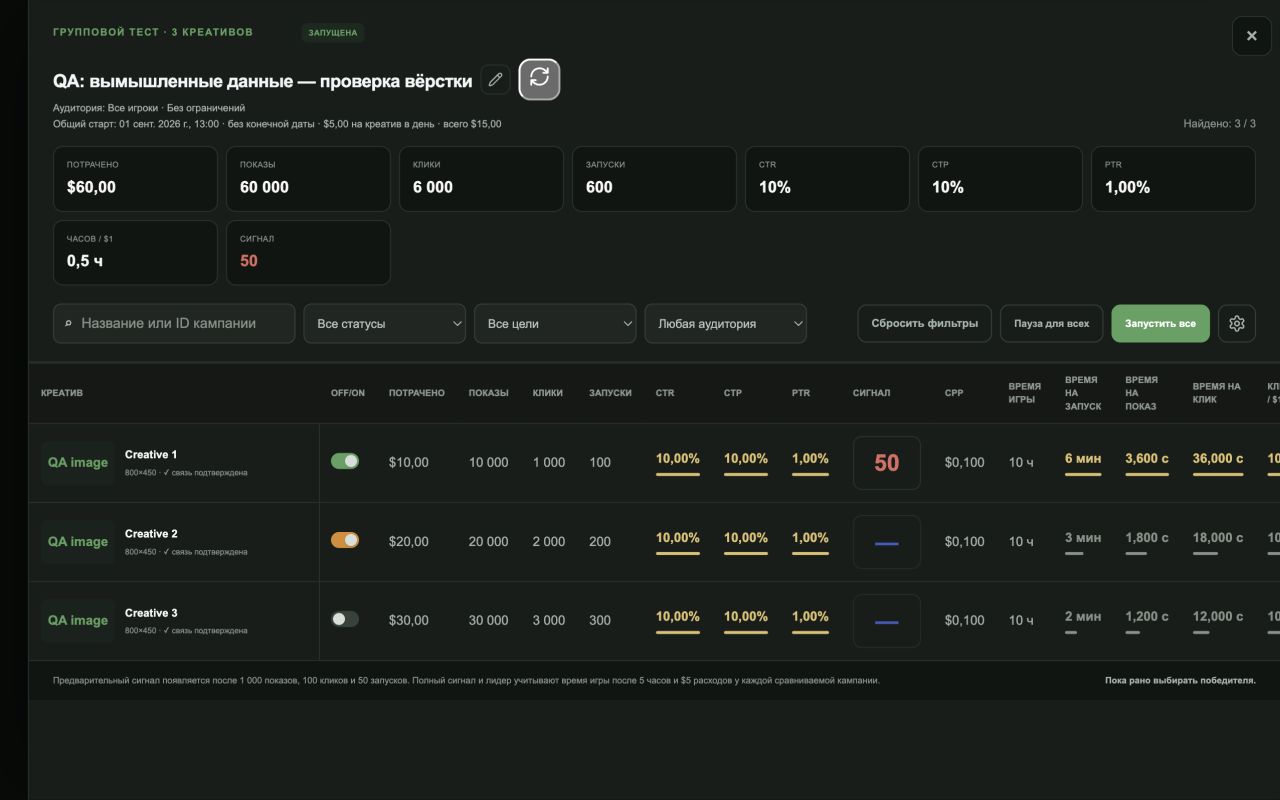
Roblox advertising: when to launch, how to target, and when to stop
A practical Roblox advertising guide: objectives, targeting, budgets, organic traffic, and pause decisions. Real interface screenshots and MARPLA workflows.
Read article →Action essentials and individual concepts (13)
 Roblox Home recommendations: action plan
 Roblox advertising: a controlled launch plan
 Roblox Home PTR and early exits: find the weak stage
 Roblox country cohorts: explain audience-mix changes
 Roblox localization and performance: diagnose early exits
 Paid and organic Roblox traffic: avoid attribution errors
 Roblox Ads objectives and audiences: choose for the decision
 Roblox Ads budgets and stop rules: economics of one answer
 Designing a Roblox ad creative test
 Roblox Home thumbnail personalization: read an adaptive test
 Roblox first-session diagnosis: from loss shape to repair
 Roblox launch operations: access, roles, stop conditions, rollback
 Roblox launch cohorts: measure an update without mixing sources