
Start analyzing a game
Public analysis helps you explore a game's audience, activity and rating.
How to use it
- Open Analysis and find a game by name or Roblox URL.
- Add the game and select Refresh.
- Select two to ten games for comparison. View their metrics over the same period.
Advice and practical context
Public-analysis boundary
Sources provide public CCU, Visits, favorites, votes, metadata, and observed history. MARPLA derives metrics only from those inputs and exposes their formulas. Private D1, session time, acquisition sources, and revenue cannot be reconstructed by guessing.
Data quality first
Before comparing two to ten games, verify Universe IDs, snapshot times, and window coverage. A game added later has shorter history. Do not read an incomplete series as low activity or compare one game's current snapshot with another's mean.
Account for vote count in ratings, the cumulative nature of Visits, and the lack of release detail in updatedAt. These three limits prevent common false conclusions. Keep source and formula available beside every derived signal.
Technical detailsCalculations, permissions and behavior
Provenance and boundaries
Public means a public Roblox fact. Derived means a calculated estimate. Owner-confirmed requires an explicit owner grant; private retention, revenue, PTR/qPTR and acquisition data are not copied from other modules.
Unavailable and a dash do not mean zero. History begins with the first independent observation. CCU is concurrent players; Visits is accumulated entries, not DAU.
Server count covers only a complete list of public root-place servers, excluding private/reserved. The sample does not cover all Roblox.
Metric formulas and limitations
The chart heading contains the metric name, guide icon and AI advice button. Descriptions and formulas are available here through the book icon; they are not repeated below AI advice, including country, language and player-activity breakdowns.
- Public score
derived. Formula: weighted mean(available group percentiles) − risk / 100 × maxRiskPenalty; without groups: weighted mean(clamp(log1p(CCU)/log1p(1000)*100), Wilson rating) − penalty. Example: See the formula for inputs and units.
Higher is a stronger signal. Below 3 groups or 40% weight is provisional; without a cohort confidence ≤20, activity is not growth.
- Data confidence
derived. Formula: min(data completeness score, available weight) × cohort confidence. Example: See the formula for inputs and units.
Higher is a stronger signal. Completeness and comparability, not growth probability.
- Risk
derived. Formula: min(100, sum(observed risk flags)). Example: See the formula for inputs and units.
Lower means fewer observed limitations. Not a claim of bots, manipulation or fraud.
- Current CCU
public. Formula: playing (Roblox Games API). Example: 250 CCU means 250 concurrent players.
Current audience size. Not Visits or daily unique players.
- Visits
public. Formula: visits (Roblox Games API). Example: 100,000 accumulated visits, including repeat visits.
Scale, not quality. Repeated visits count; not DAU.
- Activity age
derived. Formula: (asOf − sustainedActivityAt) / 86400000; fallback firstPublicAt, then createdAt. Example: 10 days since observed sustained activity.
Context, not a score. Age basis shown; already-active discoveries are left-censored.
- Universe age
derived. Formula: (asOf − createdAt) / 86400000. Example: Universe created 90 days ago.
Context. Not the public release date.
- Observation age
derived. Formula: (asOf − firstPublicAt) / 86400000. Example: Two days of independent observations.
More history. Does not prove a recent launch.
- Mean CCU · 1 hour
derived. Formula: Σ(CCUᵢ × Δtᵢ) / ΣΔtᵢ. Example: 100 CCU for 10 minutes and 200 for 20 minutes gives 166.7 CCU.
Higher is a stronger signal. Own observations only; ≥80% time coverage; gaps >20 minutes are not filled.
- CCU growth · 1 hour
derived. Formula: (mean(current window) / mean(previous equal window) − 1) × 100. Example: 150 / 100 - 1 = 50%.
Higher is a stronger signal. Zero base unavailable; baseline <25 is flagged.
- New Visits · 1 hour
derived. Formula: Visits(end) − Visits(start). Example: 102000 - 100000 = 2000 new visits.
Higher is a stronger signal. Both boundaries required; counter reset means unavailable.
- Mean CCU · 6 hours
derived. Formula: Σ(CCUᵢ × Δtᵢ) / ΣΔtᵢ. Example: 100 CCU for 10 minutes and 200 for 20 minutes gives 166.7 CCU.
Higher is a stronger signal. Own observations only; ≥80% time coverage; gaps >20 minutes are not filled.
- CCU growth · 6 hours
derived. Formula: (mean(current window) / mean(previous equal window) − 1) × 100. Example: 150 / 100 - 1 = 50%.
Higher is a stronger signal. Zero base unavailable; baseline <25 is flagged.
- New Visits · 6 hours
derived. Formula: Visits(end) − Visits(start). Example: 102000 - 100000 = 2000 new visits.
Higher is a stronger signal. Both boundaries required; counter reset means unavailable.
- Mean CCU · 24 hours
derived. Formula: Σ(CCUᵢ × Δtᵢ) / ΣΔtᵢ. Example: 100 CCU for 10 minutes and 200 for 20 minutes gives 166.7 CCU.
Higher is a stronger signal. Own observations only; ≥80% time coverage; gaps >20 minutes are not filled.
- CCU growth · 24 hours
derived. Formula: (mean(current window) / mean(previous equal window) − 1) × 100. Example: 150 / 100 - 1 = 50%.
Higher is a stronger signal. Zero base unavailable; baseline <25 is flagged.
- New Visits · 24 hours
derived. Formula: Visits(end) − Visits(start). Example: 102000 - 100000 = 2000 new visits.
Higher is a stronger signal. Both boundaries required; counter reset means unavailable.
- Mean CCU · 3 days
derived. Formula: Σ(CCUᵢ × Δtᵢ) / ΣΔtᵢ. Example: 100 CCU for 10 minutes and 200 for 20 minutes gives 166.7 CCU.
Higher is a stronger signal. Own observations only; ≥80% time coverage; gaps >20 minutes are not filled.
- CCU growth · 3 days
derived. Formula: (mean(current window) / mean(previous equal window) − 1) × 100. Example: 150 / 100 - 1 = 50%.
Higher is a stronger signal. Zero base unavailable; baseline <25 is flagged.
- New Visits · 3 days
derived. Formula: Visits(end) − Visits(start). Example: 102000 - 100000 = 2000 new visits.
Higher is a stronger signal. Both boundaries required; counter reset means unavailable.
- Mean CCU · 7 days
derived. Formula: Σ(CCUᵢ × Δtᵢ) / ΣΔtᵢ. Example: 100 CCU for 10 minutes and 200 for 20 minutes gives 166.7 CCU.
Higher is a stronger signal. Own observations only; ≥80% time coverage; gaps >20 minutes are not filled.
- CCU growth · 7 days
derived. Formula: (mean(current window) / mean(previous equal window) − 1) × 100. Example: 150 / 100 - 1 = 50%.
Higher is a stronger signal. Zero base unavailable; baseline <25 is flagged.
- New Visits · 7 days
derived. Formula: Visits(end) − Visits(start). Example: 102000 - 100000 = 2000 new visits.
Higher is a stronger signal. Both boundaries required; counter reset means unavailable.
- Mean CCU · 14 days
derived. Formula: Σ(CCUᵢ × Δtᵢ) / ΣΔtᵢ. Example: 100 CCU for 10 minutes and 200 for 20 minutes gives 166.7 CCU.
Higher is a stronger signal. Own observations only; ≥80% time coverage; gaps >20 minutes are not filled.
- CCU growth · 14 days
derived. Formula: (mean(current window) / mean(previous equal window) − 1) × 100. Example: 150 / 100 - 1 = 50%.
Higher is a stronger signal. Zero base unavailable; baseline <25 is flagged.
- New Visits · 14 days
derived. Formula: Visits(end) − Visits(start). Example: 102000 - 100000 = 2000 new visits.
Higher is a stronger signal. Both boundaries required; counter reset means unavailable.
- Mean CCU · 30 days
derived. Formula: Σ(CCUᵢ × Δtᵢ) / ΣΔtᵢ. Example: 100 CCU for 10 minutes and 200 for 20 minutes gives 166.7 CCU.
Higher is a stronger signal. Own observations only; ≥80% time coverage; gaps >20 minutes are not filled.
- CCU growth · 30 days
derived. Formula: (mean(current window) / mean(previous equal window) − 1) × 100. Example: 150 / 100 - 1 = 50%.
Higher is a stronger signal. Zero base unavailable; baseline <25 is flagged.
- New Visits · 30 days
derived. Formula: Visits(end) − Visits(start). Example: 102000 - 100000 = 2000 new visits.
Higher is a stronger signal. Both boundaries required; counter reset means unavailable.
- Early impulse
derived. Formula: meanCCU24h / activityAgeDays. Example: 250 / 5 = 50 CCU per age-day.
Higher is a stronger signal. Unavailable before a full day; age-matched cohorts.
- CCU per 100k Visits
derived. Formula: meanCCU24h / totalVisits × 100000. Example: 200 / 500000 * 100000 = 40.
Higher is a stronger signal. Not retention. Age and visit-size normalization.
- Estimated session
derived. Formula: meanCCU24h × 1440 / ΔVisits24h. Example: 100 * 1440 / 12000 = 12 minutes.
Higher is a stronger signal. Estimate only; ≥100 new visits, 0.1–240 minutes, ≥80% coverage; score needs confidence ≥50.
- Log trend · 7d
derived. Formula: OLS slope(log1p(CCU), time in days). Example: A positive log-slope indicates an upward trend.
Higher is a stronger signal. Not a future forecast; coverage required.
- Growth acceleration
derived. Formula: growth24h(now) − growth24h(previous window). Example: 50% - 20% = 30 percentage points.
Higher is a stronger signal. Three complete windows required; low-base effects.
- Stability · 24h
derived. Formula: meanCCU24h / maxCCU24h. Example: 100 / 200 = 0.5.
Higher is a stronger signal. High stability does not imply growth.
- Volatility · 24h
derived. Formula: time-weighted standard deviation / meanCCU. Example: Standard deviation 20 / mean 100 = 0.2.
Lower is steadier; early growth can be volatile. Own observations only; ≥80% time coverage; gaps >20 minutes are not filled.
- Daily activity coverage
derived. Formula: P10(hourly mean CCU) / P90(hourly mean CCU). Example: Hourly P10 of 50 / P90 of 100 = 0.5.
Higher is a stronger signal. ≥20 complete hours required. Not geography.
- Peak preservation · 24–48h
derived. Formula: meanCCU(24–48h after peak) / peakCCU. Example: 80 / 200 = 0.4 peak preservation.
Higher is a stronger signal. Only after the window matures; cause unknown.
- Peak preservation · 72–96h
derived. Formula: meanCCU(72–96h after peak) / peakCCU. Example: 80 / 200 = 0.4 peak preservation.
Higher is a stronger signal. Only after the window matures; cause unknown.
- Peak preservation · 7–8d
derived. Formula: meanCCU(7–8d after peak) / peakCCU. Example: 80 / 200 = 0.4 peak preservation.
Higher is a stronger signal. Only after the window matures; cause unknown.
- Roblox favorites
public. Formula: favoritedCount (Roblox Games API). Example: 500 public favorites.
Size. Public cumulative counter.
- Favorites / 1000 Visits
derived. Formula: ΔFavorites24h / ΔVisits24h × 1000. Example: 20 new favorites / 2000 new visits * 1000 = 10.
Higher is a stronger signal. ≥100 new visits; not a unique-player conversion.
- Upvotes / 1000 Visits
derived. Formula: ΔUpvotes24h / ΔVisits24h × 1000. Example: 10 / 2000 * 1000 = 5.
Higher is a stronger signal. Votes can be withdrawn; negative counters are excluded.
- Rating
public. Formula: up / (up + down) × 100. Example: 90 / (90 + 10) = 90%.
Higher is better. Consider sample size; scoring uses Wilson.
- Rating Wilson lower bound
derived. Formula: 95% Wilson lower confidence bound, z = 1.96. Example: 90 positive votes out of 100 gives a lower bound of about 82.6%.
Higher is a stronger signal. Conservative positive-vote share, not game quality.
- Text originality
derived. Formula: 1 − max(Jaccard(name + description, peers)). Example: Maximum text similarity 0.3 gives originality 0.7.
Higher is a stronger signal. ≥10 games; ≥3 shared meaningful words; not a plagiarism finding.
- Genre opportunity
derived. Formula: tanh(genreGrowth7d/100) + growingShare − cloneDensity − top3Share. Example: A growing niche with lower concentration receives a higher index.
Higher is a stronger signal. Observed sample only; ≥10 games with week history.
- Top 3 concentration
derived. Formula: Σ top3 meanCCU24h / Σ genre meanCCU24h. Example: 600 / 1000 = 0.6.
Lower concentration. Not all Roblox.
- Genre growth · 7d
derived. Formula: (Σ comparable mean7d / Σ previous mean7d − 1) × 100. Example: 1200 / 1000 - 1 = 20%.
Higher is a stronger signal. Comparable fixed set, not the entire platform.
- After update · 24h
derived. Formula: (meanCCU(24h after observed update) / meanCCU(7d before) − 1) × 100. Example: 150 / 100 - 1 = 50%.
Higher is a stronger signal. Temporal association, not causation; updatedAt is not a full release log.
- After update · 72h
derived. Formula: (meanCCU(72h after observed update) / meanCCU(7d before) − 1) × 100. Example: 150 / 100 - 1 = 50%.
Higher is a stronger signal. Temporal association, not causation; updatedAt is not a full release log.
- After update · 7d
derived. Formula: (meanCCU(7d after observed update) / meanCCU(7d before) − 1) × 100. Example: 150 / 100 - 1 = 50%.
Higher is a stronger signal. Temporal association, not causation; updatedAt is not a full release log.
- Observed updates · 30d
derived. Formula: count(observed updatedAt changes in 30d). Example: Three observed updatedAt changes.
Context. Changes before first observation are unknown.
- Days since update
derived. Formula: (asOf − updatedAt) / 86400000. Example: Two days since the reported update.
Context. Roblox timestamp, not proof of significant content.
- Run ≥100 CCU
derived. Formula: longest consecutive observed interval with CCU ≥100. Example: 36 consecutive observed hours above 100 CCU.
Higher is a stronger signal. Gaps break runs; milestones require ≥3 hours.
- Public servers
public. Formula: count(complete Public root-place server list). Example: 62 servers in a complete public root-place list.
Context. Partial lists unavailable; excludes private/reserved.
- Public server occupancy
derived. Formula: Σ players in public root servers / Σ capacity ×100. Example: 50 players / 100 available slots = 50%.
Higher is a stronger signal. Complete public root-place list only, not global CCU.
- 24h completeness
derived. Formula: Σ accepted sample intervals / 24h ×100. Example: 20 observed hours / 24 = 83.3%.
Higher is a stronger signal. Intervals need two valid bounding samples.
- MEDIAN CCU · 1 hour
derived. Formula: median(CCU weighted by observed duration). Example: See the formula for inputs and units.
Distribution context. Own observations only; ≥80% time coverage; gaps >20 minutes are not filled.
- MIN CCU · 1 hour
derived. Formula: min(CCU weighted by observed duration). Example: See the formula for inputs and units.
Distribution context. Own observations only; ≥80% time coverage; gaps >20 minutes are not filled.
- MAX CCU · 1 hour
derived. Formula: max(CCU weighted by observed duration). Example: See the formula for inputs and units.
Distribution context. Own observations only; ≥80% time coverage; gaps >20 minutes are not filled.
- P10 CCU · 1 hour
derived. Formula: p10(CCU weighted by observed duration). Example: See the formula for inputs and units.
Distribution context. Own observations only; ≥80% time coverage; gaps >20 minutes are not filled.
- P25 CCU · 1 hour
derived. Formula: p25(CCU weighted by observed duration). Example: See the formula for inputs and units.
Distribution context. Own observations only; ≥80% time coverage; gaps >20 minutes are not filled.
- P75 CCU · 1 hour
derived. Formula: p75(CCU weighted by observed duration). Example: See the formula for inputs and units.
Distribution context. Own observations only; ≥80% time coverage; gaps >20 minutes are not filled.
- P90 CCU · 1 hour
derived. Formula: p90(CCU weighted by observed duration). Example: See the formula for inputs and units.
Distribution context. Own observations only; ≥80% time coverage; gaps >20 minutes are not filled.
- MEDIAN CCU · 6 hours
derived. Formula: median(CCU weighted by observed duration). Example: See the formula for inputs and units.
Distribution context. Own observations only; ≥80% time coverage; gaps >20 minutes are not filled.
- MIN CCU · 6 hours
derived. Formula: min(CCU weighted by observed duration). Example: See the formula for inputs and units.
Distribution context. Own observations only; ≥80% time coverage; gaps >20 minutes are not filled.
- MAX CCU · 6 hours
derived. Formula: max(CCU weighted by observed duration). Example: See the formula for inputs and units.
Distribution context. Own observations only; ≥80% time coverage; gaps >20 minutes are not filled.
- P10 CCU · 6 hours
derived. Formula: p10(CCU weighted by observed duration). Example: See the formula for inputs and units.
Distribution context. Own observations only; ≥80% time coverage; gaps >20 minutes are not filled.
- P25 CCU · 6 hours
derived. Formula: p25(CCU weighted by observed duration). Example: See the formula for inputs and units.
Distribution context. Own observations only; ≥80% time coverage; gaps >20 minutes are not filled.
- P75 CCU · 6 hours
derived. Formula: p75(CCU weighted by observed duration). Example: See the formula for inputs and units.
Distribution context. Own observations only; ≥80% time coverage; gaps >20 minutes are not filled.
- P90 CCU · 6 hours
derived. Formula: p90(CCU weighted by observed duration). Example: See the formula for inputs and units.
Distribution context. Own observations only; ≥80% time coverage; gaps >20 minutes are not filled.
- MEDIAN CCU · 24 hours
derived. Formula: median(CCU weighted by observed duration). Example: See the formula for inputs and units.
Distribution context. Own observations only; ≥80% time coverage; gaps >20 minutes are not filled.
- MIN CCU · 24 hours
derived. Formula: min(CCU weighted by observed duration). Example: See the formula for inputs and units.
Distribution context. Own observations only; ≥80% time coverage; gaps >20 minutes are not filled.
- MAX CCU · 24 hours
derived. Formula: max(CCU weighted by observed duration). Example: See the formula for inputs and units.
Distribution context. Own observations only; ≥80% time coverage; gaps >20 minutes are not filled.
- P10 CCU · 24 hours
derived. Formula: p10(CCU weighted by observed duration). Example: See the formula for inputs and units.
Distribution context. Own observations only; ≥80% time coverage; gaps >20 minutes are not filled.
- P25 CCU · 24 hours
derived. Formula: p25(CCU weighted by observed duration). Example: See the formula for inputs and units.
Distribution context. Own observations only; ≥80% time coverage; gaps >20 minutes are not filled.
- P75 CCU · 24 hours
derived. Formula: p75(CCU weighted by observed duration). Example: See the formula for inputs and units.
Distribution context. Own observations only; ≥80% time coverage; gaps >20 minutes are not filled.
- P90 CCU · 24 hours
derived. Formula: p90(CCU weighted by observed duration). Example: See the formula for inputs and units.
Distribution context. Own observations only; ≥80% time coverage; gaps >20 minutes are not filled.
- MEDIAN CCU · 3 days
derived. Formula: median(CCU weighted by observed duration). Example: See the formula for inputs and units.
Distribution context. Own observations only; ≥80% time coverage; gaps >20 minutes are not filled.
- MIN CCU · 3 days
derived. Formula: min(CCU weighted by observed duration). Example: See the formula for inputs and units.
Distribution context. Own observations only; ≥80% time coverage; gaps >20 minutes are not filled.
- MAX CCU · 3 days
derived. Formula: max(CCU weighted by observed duration). Example: See the formula for inputs and units.
Distribution context. Own observations only; ≥80% time coverage; gaps >20 minutes are not filled.
- P10 CCU · 3 days
derived. Formula: p10(CCU weighted by observed duration). Example: See the formula for inputs and units.
Distribution context. Own observations only; ≥80% time coverage; gaps >20 minutes are not filled.
- P25 CCU · 3 days
derived. Formula: p25(CCU weighted by observed duration). Example: See the formula for inputs and units.
Distribution context. Own observations only; ≥80% time coverage; gaps >20 minutes are not filled.
- P75 CCU · 3 days
derived. Formula: p75(CCU weighted by observed duration). Example: See the formula for inputs and units.
Distribution context. Own observations only; ≥80% time coverage; gaps >20 minutes are not filled.
- P90 CCU · 3 days
derived. Formula: p90(CCU weighted by observed duration). Example: See the formula for inputs and units.
Distribution context. Own observations only; ≥80% time coverage; gaps >20 minutes are not filled.
- MEDIAN CCU · 7 days
derived. Formula: median(CCU weighted by observed duration). Example: See the formula for inputs and units.
Distribution context. Own observations only; ≥80% time coverage; gaps >20 minutes are not filled.
- MIN CCU · 7 days
derived. Formula: min(CCU weighted by observed duration). Example: See the formula for inputs and units.
Distribution context. Own observations only; ≥80% time coverage; gaps >20 minutes are not filled.
- MAX CCU · 7 days
derived. Formula: max(CCU weighted by observed duration). Example: See the formula for inputs and units.
Distribution context. Own observations only; ≥80% time coverage; gaps >20 minutes are not filled.
- P10 CCU · 7 days
derived. Formula: p10(CCU weighted by observed duration). Example: See the formula for inputs and units.
Distribution context. Own observations only; ≥80% time coverage; gaps >20 minutes are not filled.
- P25 CCU · 7 days
derived. Formula: p25(CCU weighted by observed duration). Example: See the formula for inputs and units.
Distribution context. Own observations only; ≥80% time coverage; gaps >20 minutes are not filled.
- P75 CCU · 7 days
derived. Formula: p75(CCU weighted by observed duration). Example: See the formula for inputs and units.
Distribution context. Own observations only; ≥80% time coverage; gaps >20 minutes are not filled.
- P90 CCU · 7 days
derived. Formula: p90(CCU weighted by observed duration). Example: See the formula for inputs and units.
Distribution context. Own observations only; ≥80% time coverage; gaps >20 minutes are not filled.
- MEDIAN CCU · 14 days
derived. Formula: median(CCU weighted by observed duration). Example: See the formula for inputs and units.
Distribution context. Own observations only; ≥80% time coverage; gaps >20 minutes are not filled.
- MIN CCU · 14 days
derived. Formula: min(CCU weighted by observed duration). Example: See the formula for inputs and units.
Distribution context. Own observations only; ≥80% time coverage; gaps >20 minutes are not filled.
- MAX CCU · 14 days
derived. Formula: max(CCU weighted by observed duration). Example: See the formula for inputs and units.
Distribution context. Own observations only; ≥80% time coverage; gaps >20 minutes are not filled.
- P10 CCU · 14 days
derived. Formula: p10(CCU weighted by observed duration). Example: See the formula for inputs and units.
Distribution context. Own observations only; ≥80% time coverage; gaps >20 minutes are not filled.
- P25 CCU · 14 days
derived. Formula: p25(CCU weighted by observed duration). Example: See the formula for inputs and units.
Distribution context. Own observations only; ≥80% time coverage; gaps >20 minutes are not filled.
- P75 CCU · 14 days
derived. Formula: p75(CCU weighted by observed duration). Example: See the formula for inputs and units.
Distribution context. Own observations only; ≥80% time coverage; gaps >20 minutes are not filled.
- P90 CCU · 14 days
derived. Formula: p90(CCU weighted by observed duration). Example: See the formula for inputs and units.
Distribution context. Own observations only; ≥80% time coverage; gaps >20 minutes are not filled.
- MEDIAN CCU · 30 days
derived. Formula: median(CCU weighted by observed duration). Example: See the formula for inputs and units.
Distribution context. Own observations only; ≥80% time coverage; gaps >20 minutes are not filled.
- MIN CCU · 30 days
derived. Formula: min(CCU weighted by observed duration). Example: See the formula for inputs and units.
Distribution context. Own observations only; ≥80% time coverage; gaps >20 minutes are not filled.
- MAX CCU · 30 days
derived. Formula: max(CCU weighted by observed duration). Example: See the formula for inputs and units.
Distribution context. Own observations only; ≥80% time coverage; gaps >20 minutes are not filled.
- P10 CCU · 30 days
derived. Formula: p10(CCU weighted by observed duration). Example: See the formula for inputs and units.
Distribution context. Own observations only; ≥80% time coverage; gaps >20 minutes are not filled.
- P25 CCU · 30 days
derived. Formula: p25(CCU weighted by observed duration). Example: See the formula for inputs and units.
Distribution context. Own observations only; ≥80% time coverage; gaps >20 minutes are not filled.
- P75 CCU · 30 days
derived. Formula: p75(CCU weighted by observed duration). Example: See the formula for inputs and units.
Distribution context. Own observations only; ≥80% time coverage; gaps >20 minutes are not filled.
- P90 CCU · 30 days
derived. Formula: p90(CCU weighted by observed duration). Example: See the formula for inputs and units.
Distribution context. Own observations only; ≥80% time coverage; gaps >20 minutes are not filled.
- update effect · Ccu · 1d
derived. Formula: (meanCCU(1d after) / meanCCU(7d before) − 1) × 100. Example: See the formula for inputs and units.
Higher is a stronger signal. Only mature observed windows; temporal association is not causation.
- update effect · visits · 1d
derived. Formula: (deltavisits(1d after) / 1 / (deltavisits(7d before) / 7) − 1) × 100. Example: See the formula for inputs and units.
Higher is a stronger signal. Only mature observed windows; temporal association is not causation.
- update effect · favorites · 1d
derived. Formula: (deltafavorites(1d after) / 1 / (deltafavorites(7d before) / 7) − 1) × 100. Example: See the formula for inputs and units.
Higher is a stronger signal. Only mature observed windows; temporal association is not causation.
- update effect · upVotes · 1d
derived. Formula: (deltaupVotes(1d after) / 1 / (deltaupVotes(7d before) / 7) − 1) × 100. Example: See the formula for inputs and units.
Higher is a stronger signal. Only mature observed windows; temporal association is not causation.
- update effect · Ccu · 3d
derived. Formula: (meanCCU(3d after) / meanCCU(7d before) − 1) × 100. Example: See the formula for inputs and units.
Higher is a stronger signal. Only mature observed windows; temporal association is not causation.
- update effect · visits · 3d
derived. Formula: (deltavisits(3d after) / 3 / (deltavisits(7d before) / 7) − 1) × 100. Example: See the formula for inputs and units.
Higher is a stronger signal. Only mature observed windows; temporal association is not causation.
- update effect · favorites · 3d
derived. Formula: (deltafavorites(3d after) / 3 / (deltafavorites(7d before) / 7) − 1) × 100. Example: See the formula for inputs and units.
Higher is a stronger signal. Only mature observed windows; temporal association is not causation.
- update effect · upVotes · 3d
derived. Formula: (deltaupVotes(3d after) / 3 / (deltaupVotes(7d before) / 7) − 1) × 100. Example: See the formula for inputs and units.
Higher is a stronger signal. Only mature observed windows; temporal association is not causation.
- update effect · Ccu · 7d
derived. Formula: (meanCCU(7d after) / meanCCU(7d before) − 1) × 100. Example: See the formula for inputs and units.
Higher is a stronger signal. Only mature observed windows; temporal association is not causation.
- update effect · visits · 7d
derived. Formula: (deltavisits(7d after) / 7 / (deltavisits(7d before) / 7) − 1) × 100. Example: See the formula for inputs and units.
Higher is a stronger signal. Only mature observed windows; temporal association is not causation.
- update effect · favorites · 7d
derived. Formula: (deltafavorites(7d after) / 7 / (deltafavorites(7d before) / 7) − 1) × 100. Example: See the formula for inputs and units.
Higher is a stronger signal. Only mature observed windows; temporal association is not causation.
- update effect · upVotes · 7d
derived. Formula: (deltaupVotes(7d after) / 7 / (deltaupVotes(7d before) / 7) − 1) × 100. Example: See the formula for inputs and units.
Higher is a stronger signal. Only mature observed windows; temporal association is not causation.
- title effect · Ccu · 1d
derived. Formula: (meanCCU(1d after) / meanCCU(7d before) − 1) × 100. Example: See the formula for inputs and units.
Higher is a stronger signal. Only mature observed windows; temporal association is not causation.
- title effect · visits · 1d
derived. Formula: (deltavisits(1d after) / 1 / (deltavisits(7d before) / 7) − 1) × 100. Example: See the formula for inputs and units.
Higher is a stronger signal. Only mature observed windows; temporal association is not causation.
- title effect · favorites · 1d
derived. Formula: (deltafavorites(1d after) / 1 / (deltafavorites(7d before) / 7) − 1) × 100. Example: See the formula for inputs and units.
Higher is a stronger signal. Only mature observed windows; temporal association is not causation.
- title effect · upVotes · 1d
derived. Formula: (deltaupVotes(1d after) / 1 / (deltaupVotes(7d before) / 7) − 1) × 100. Example: See the formula for inputs and units.
Higher is a stronger signal. Only mature observed windows; temporal association is not causation.
- title effect · Ccu · 3d
derived. Formula: (meanCCU(3d after) / meanCCU(7d before) − 1) × 100. Example: See the formula for inputs and units.
Higher is a stronger signal. Only mature observed windows; temporal association is not causation.
- title effect · visits · 3d
derived. Formula: (deltavisits(3d after) / 3 / (deltavisits(7d before) / 7) − 1) × 100. Example: See the formula for inputs and units.
Higher is a stronger signal. Only mature observed windows; temporal association is not causation.
- title effect · favorites · 3d
derived. Formula: (deltafavorites(3d after) / 3 / (deltafavorites(7d before) / 7) − 1) × 100. Example: See the formula for inputs and units.
Higher is a stronger signal. Only mature observed windows; temporal association is not causation.
- title effect · upVotes · 3d
derived. Formula: (deltaupVotes(3d after) / 3 / (deltaupVotes(7d before) / 7) − 1) × 100. Example: See the formula for inputs and units.
Higher is a stronger signal. Only mature observed windows; temporal association is not causation.
- title effect · Ccu · 7d
derived. Formula: (meanCCU(7d after) / meanCCU(7d before) − 1) × 100. Example: See the formula for inputs and units.
Higher is a stronger signal. Only mature observed windows; temporal association is not causation.
- title effect · visits · 7d
derived. Formula: (deltavisits(7d after) / 7 / (deltavisits(7d before) / 7) − 1) × 100. Example: See the formula for inputs and units.
Higher is a stronger signal. Only mature observed windows; temporal association is not causation.
- title effect · favorites · 7d
derived. Formula: (deltafavorites(7d after) / 7 / (deltafavorites(7d before) / 7) − 1) × 100. Example: See the formula for inputs and units.
Higher is a stronger signal. Only mature observed windows; temporal association is not causation.
- title effect · upVotes · 7d
derived. Formula: (deltaupVotes(7d after) / 7 / (deltaupVotes(7d before) / 7) − 1) × 100. Example: See the formula for inputs and units.
Higher is a stronger signal. Only mature observed windows; temporal association is not causation.
- description effect · Ccu · 1d
derived. Formula: (meanCCU(1d after) / meanCCU(7d before) − 1) × 100. Example: See the formula for inputs and units.
Higher is a stronger signal. Only mature observed windows; temporal association is not causation.
- description effect · visits · 1d
derived. Formula: (deltavisits(1d after) / 1 / (deltavisits(7d before) / 7) − 1) × 100. Example: See the formula for inputs and units.
Higher is a stronger signal. Only mature observed windows; temporal association is not causation.
- description effect · favorites · 1d
derived. Formula: (deltafavorites(1d after) / 1 / (deltafavorites(7d before) / 7) − 1) × 100. Example: See the formula for inputs and units.
Higher is a stronger signal. Only mature observed windows; temporal association is not causation.
- description effect · upVotes · 1d
derived. Formula: (deltaupVotes(1d after) / 1 / (deltaupVotes(7d before) / 7) − 1) × 100. Example: See the formula for inputs and units.
Higher is a stronger signal. Only mature observed windows; temporal association is not causation.
- description effect · Ccu · 3d
derived. Formula: (meanCCU(3d after) / meanCCU(7d before) − 1) × 100. Example: See the formula for inputs and units.
Higher is a stronger signal. Only mature observed windows; temporal association is not causation.
- description effect · visits · 3d
derived. Formula: (deltavisits(3d after) / 3 / (deltavisits(7d before) / 7) − 1) × 100. Example: See the formula for inputs and units.
Higher is a stronger signal. Only mature observed windows; temporal association is not causation.
- description effect · favorites · 3d
derived. Formula: (deltafavorites(3d after) / 3 / (deltafavorites(7d before) / 7) − 1) × 100. Example: See the formula for inputs and units.
Higher is a stronger signal. Only mature observed windows; temporal association is not causation.
- description effect · upVotes · 3d
derived. Formula: (deltaupVotes(3d after) / 3 / (deltaupVotes(7d before) / 7) − 1) × 100. Example: See the formula for inputs and units.
Higher is a stronger signal. Only mature observed windows; temporal association is not causation.
- description effect · Ccu · 7d
derived. Formula: (meanCCU(7d after) / meanCCU(7d before) − 1) × 100. Example: See the formula for inputs and units.
Higher is a stronger signal. Only mature observed windows; temporal association is not causation.
- description effect · visits · 7d
derived. Formula: (deltavisits(7d after) / 7 / (deltavisits(7d before) / 7) − 1) × 100. Example: See the formula for inputs and units.
Higher is a stronger signal. Only mature observed windows; temporal association is not causation.
- description effect · favorites · 7d
derived. Formula: (deltafavorites(7d after) / 7 / (deltafavorites(7d before) / 7) − 1) × 100. Example: See the formula for inputs and units.
Higher is a stronger signal. Only mature observed windows; temporal association is not causation.
- description effect · upVotes · 7d
derived. Formula: (deltaupVotes(7d after) / 7 / (deltaupVotes(7d before) / 7) − 1) × 100. Example: See the formula for inputs and units.
Higher is a stronger signal. Only mature observed windows; temporal association is not causation.
- icon effect · Ccu · 1d
derived. Formula: (meanCCU(1d after) / meanCCU(7d before) − 1) × 100. Example: See the formula for inputs and units.
Higher is a stronger signal. Only mature observed windows; temporal association is not causation.
- icon effect · visits · 1d
derived. Formula: (deltavisits(1d after) / 1 / (deltavisits(7d before) / 7) − 1) × 100. Example: See the formula for inputs and units.
Higher is a stronger signal. Only mature observed windows; temporal association is not causation.
- icon effect · favorites · 1d
derived. Formula: (deltafavorites(1d after) / 1 / (deltafavorites(7d before) / 7) − 1) × 100. Example: See the formula for inputs and units.
Higher is a stronger signal. Only mature observed windows; temporal association is not causation.
- icon effect · upVotes · 1d
derived. Formula: (deltaupVotes(1d after) / 1 / (deltaupVotes(7d before) / 7) − 1) × 100. Example: See the formula for inputs and units.
Higher is a stronger signal. Only mature observed windows; temporal association is not causation.
- icon effect · Ccu · 3d
derived. Formula: (meanCCU(3d after) / meanCCU(7d before) − 1) × 100. Example: See the formula for inputs and units.
Higher is a stronger signal. Only mature observed windows; temporal association is not causation.
- icon effect · visits · 3d
derived. Formula: (deltavisits(3d after) / 3 / (deltavisits(7d before) / 7) − 1) × 100. Example: See the formula for inputs and units.
Higher is a stronger signal. Only mature observed windows; temporal association is not causation.
- icon effect · favorites · 3d
derived. Formula: (deltafavorites(3d after) / 3 / (deltafavorites(7d before) / 7) − 1) × 100. Example: See the formula for inputs and units.
Higher is a stronger signal. Only mature observed windows; temporal association is not causation.
- icon effect · upVotes · 3d
derived. Formula: (deltaupVotes(3d after) / 3 / (deltaupVotes(7d before) / 7) − 1) × 100. Example: See the formula for inputs and units.
Higher is a stronger signal. Only mature observed windows; temporal association is not causation.
- icon effect · Ccu · 7d
derived. Formula: (meanCCU(7d after) / meanCCU(7d before) − 1) × 100. Example: See the formula for inputs and units.
Higher is a stronger signal. Only mature observed windows; temporal association is not causation.
- icon effect · visits · 7d
derived. Formula: (deltavisits(7d after) / 7 / (deltavisits(7d before) / 7) − 1) × 100. Example: See the formula for inputs and units.
Higher is a stronger signal. Only mature observed windows; temporal association is not causation.
- icon effect · favorites · 7d
derived. Formula: (deltafavorites(7d after) / 7 / (deltafavorites(7d before) / 7) − 1) × 100. Example: See the formula for inputs and units.
Higher is a stronger signal. Only mature observed windows; temporal association is not causation.
- icon effect · upVotes · 7d
derived. Formula: (deltaupVotes(7d after) / 7 / (deltaupVotes(7d before) / 7) − 1) × 100. Example: See the formula for inputs and units.
Higher is a stronger signal. Only mature observed windows; temporal association is not causation.
- cover effect · Ccu · 1d
derived. Formula: (meanCCU(1d after) / meanCCU(7d before) − 1) × 100. Example: See the formula for inputs and units.
Higher is a stronger signal. Only mature observed windows; temporal association is not causation.
- cover effect · visits · 1d
derived. Formula: (deltavisits(1d after) / 1 / (deltavisits(7d before) / 7) − 1) × 100. Example: See the formula for inputs and units.
Higher is a stronger signal. Only mature observed windows; temporal association is not causation.
- cover effect · favorites · 1d
derived. Formula: (deltafavorites(1d after) / 1 / (deltafavorites(7d before) / 7) − 1) × 100. Example: See the formula for inputs and units.
Higher is a stronger signal. Only mature observed windows; temporal association is not causation.
- cover effect · upVotes · 1d
derived. Formula: (deltaupVotes(1d after) / 1 / (deltaupVotes(7d before) / 7) − 1) × 100. Example: See the formula for inputs and units.
Higher is a stronger signal. Only mature observed windows; temporal association is not causation.
- cover effect · Ccu · 3d
derived. Formula: (meanCCU(3d after) / meanCCU(7d before) − 1) × 100. Example: See the formula for inputs and units.
Higher is a stronger signal. Only mature observed windows; temporal association is not causation.
- cover effect · visits · 3d
derived. Formula: (deltavisits(3d after) / 3 / (deltavisits(7d before) / 7) − 1) × 100. Example: See the formula for inputs and units.
Higher is a stronger signal. Only mature observed windows; temporal association is not causation.
- cover effect · favorites · 3d
derived. Formula: (deltafavorites(3d after) / 3 / (deltafavorites(7d before) / 7) − 1) × 100. Example: See the formula for inputs and units.
Higher is a stronger signal. Only mature observed windows; temporal association is not causation.
- cover effect · upVotes · 3d
derived. Formula: (deltaupVotes(3d after) / 3 / (deltaupVotes(7d before) / 7) − 1) × 100. Example: See the formula for inputs and units.
Higher is a stronger signal. Only mature observed windows; temporal association is not causation.
- cover effect · Ccu · 7d
derived. Formula: (meanCCU(7d after) / meanCCU(7d before) − 1) × 100. Example: See the formula for inputs and units.
Higher is a stronger signal. Only mature observed windows; temporal association is not causation.
- cover effect · visits · 7d
derived. Formula: (deltavisits(7d after) / 7 / (deltavisits(7d before) / 7) − 1) × 100. Example: See the formula for inputs and units.
Higher is a stronger signal. Only mature observed windows; temporal association is not causation.
- cover effect · favorites · 7d
derived. Formula: (deltafavorites(7d after) / 7 / (deltafavorites(7d before) / 7) − 1) × 100. Example: See the formula for inputs and units.
Higher is a stronger signal. Only mature observed windows; temporal association is not causation.
- cover effect · upVotes · 7d
derived. Formula: (deltaupVotes(7d after) / 7 / (deltaupVotes(7d before) / 7) − 1) × 100. Example: See the formula for inputs and units.
Higher is a stronger signal. Only mature observed windows; temporal association is not causation.
- D1 / D7 / D30 retention
unavailable. Formula: Owner-confirmed only. Example: No public estimate.
Unavailable. Requires explicit owner grant; excluded from public score.
- Revenue, PTR / qPTR and acquisition
unavailable. Formula: Owner-confirmed only. Example: No fabricated revenue or acquisition estimate.
Unavailable. Private MARPLA data is never copied into this public module.
Useful articles: examples and decisions
The guide covers the steps in the service. These articles explain the metrics, examples, techniques and how to evaluate results.

MARPLA public-data methodology and privacy boundaries
Understand sources, sampling, derived metrics, access controls and the limits of public Roblox research.
Read article →
How to analyze a Roblox game before investing time or money
A repeatable due-diligence workflow that separates public evidence, owner-only analytics, hypotheses, and unanswered questions.
Read article →
How to compare Roblox games fairly
Build a peer set, align time windows, normalize scale, and keep public comparisons within what the data supports.
Read article →
Public Roblox data vs owner analytics
Know what can be observed from the market, what requires permission, and where public estimates must stop.
Read article →Action essentials and individual concepts (11)
 Roblox game analysis essentials: question, evidence, decision
 Fair Roblox game comparisons: the essential checklist
 Public vs owner Roblox analytics: the access boundary
 MARPLA methodology essentials: sources, derivations, privacy
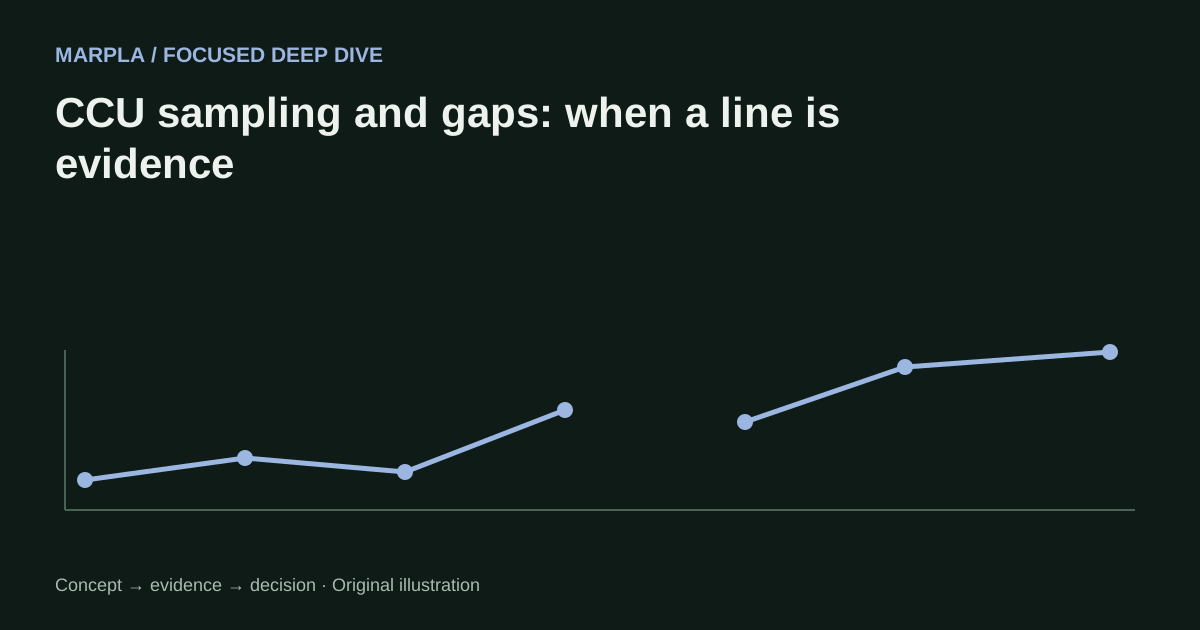 CCU sampling and gaps: when a line is evidence
 Roblox Visits vs players: counters that answer different questions
 Comparable peers and matched windows for Roblox analysis
 Owner analytics diligence: access, evidence, and scope
 Before-and-after update analysis: baselines and confounders
 From watchlist to decision: a Roblox research queue
 A public-data evidence ledger for Roblox research