Compare advertising results
Reports help you see which campaigns bring players and at what cost.
How to use it
- Inside one campaign, images come from its Asset ID list even when the current catalog is incomplete. A dash means the exact creative report is not yet available; campaign totals are never distributed arbitrarily across creatives.
- Choose a range and review Ads Manager report impressions, clicks, plays and spend. The warning beside the heading explains incomplete coverage. In the same card, Users with impressions/clicks/plays and All/New/Returning users select unique audiences. Report metric buttons return to Ads Manager; the sources are not summed. Milestones shows observed campaign budget, audience, delivery and creative changes. Hover a marker for details and the observation time.
- Compare Time per impression and Time per click in seconds with three decimal places; calculations retain full precision. Time per play uses minutes. Colors and bars help compare rows; click a heading to sort. Each divides attributed in-game time by its matching count for the same period; together they contribute 30% of the complete Signal. In the main table and inside a group, compare Clicks / $1, Impressions / $1 and Plays / $1: each count divided by spend for the same range. Group totals use the ratio of sums; incomplete inputs give a dash. Colors show relative ranking, bars the share of the maximum. Click headings to sort; the main table CSV includes these metrics. A dash means missing data or zero spend. Group settings switches between the saved stop result and current data. Automatic tests show their shared audience in a plain line; per-campaign settings expand only in manual groups.
- Switch metrics and campaign lines. All lines start hidden. Select the thumbnails you need or Show all lines. Each line toggle shows its creative thumbnail; the colored dot matches the chart line. Playtime per $1 helps compare the playtime gained with costs.
Advice and practical context
Funnel, not one winner
Impressions describe delivery, clicks response, plays entry, and playtime downstream behavior. Cheap plays can coexist with weak sessions. Playtime per $1 connects acquired playtime to spend but does not equal profit.
Comparing results
Compare campaigns over the same complete period and account for volume. A leader on very low spend can remain uncertain. Do not select a winner by CTR without checking plays, player quality, and actual spend.
For creatives, confirm they served inside one campaign over comparable periods. For campaigns, ensure the group represents one test question. Otherwise audience and budget differences can dominate the image and make rankings misleading.
Technical detailsCalculations, permissions and behavior
Single campaign history
Open a campaign and select a metric card in Campaign results. Its history appears below for the selected period, scoped to this campaign only. CTR, CTP, PTR, CPP and time metrics use raw values from the same day; summary totals are never copied across days.
Missing history shows a message rather than zeroes.
Reporting & attribution
A campaign’s Asset IDs define its creative rows, so images remain visible even without a current catalog entry. Per-image metrics require an exact campaign relation; missing values are never replaced by zero or a share of the campaign total. One campaign with several images and a group of separate campaigns are calculated separately.
Spend uses the source report’s units: dollars or microdollars. Roblox includes repeat plays and attribution for up to 30 days, so plays can exceed clicks. Ad attribution arrives after an event and can be revised later; compare matching windows.
Impressions and clicks are normally available sooner, while plays, playtime and earnings can take up to 48 hours to settle. The audience switch is always open: All users, New and Returning are visible together, with the active option highlighted. Stored results remain visible during delays.
For campaigns absent from the Analytics API breakdown, MARPLA sends one batched request for their exact Campaign IDs to Ads Manager and sums the returned ad metrics within each campaign. Creative-level reporting is not required. Table order is Off/On, spend, impressions, clicks, plays, CTR, CTP and PTR, followed by the remaining metrics.
CTP is plays ÷ clicks; PTR is plays ÷ impressions. Hover a column name to see its definition and formula. Drag any column header except the pinned creative or campaign name; the chosen order is saved in this browser.
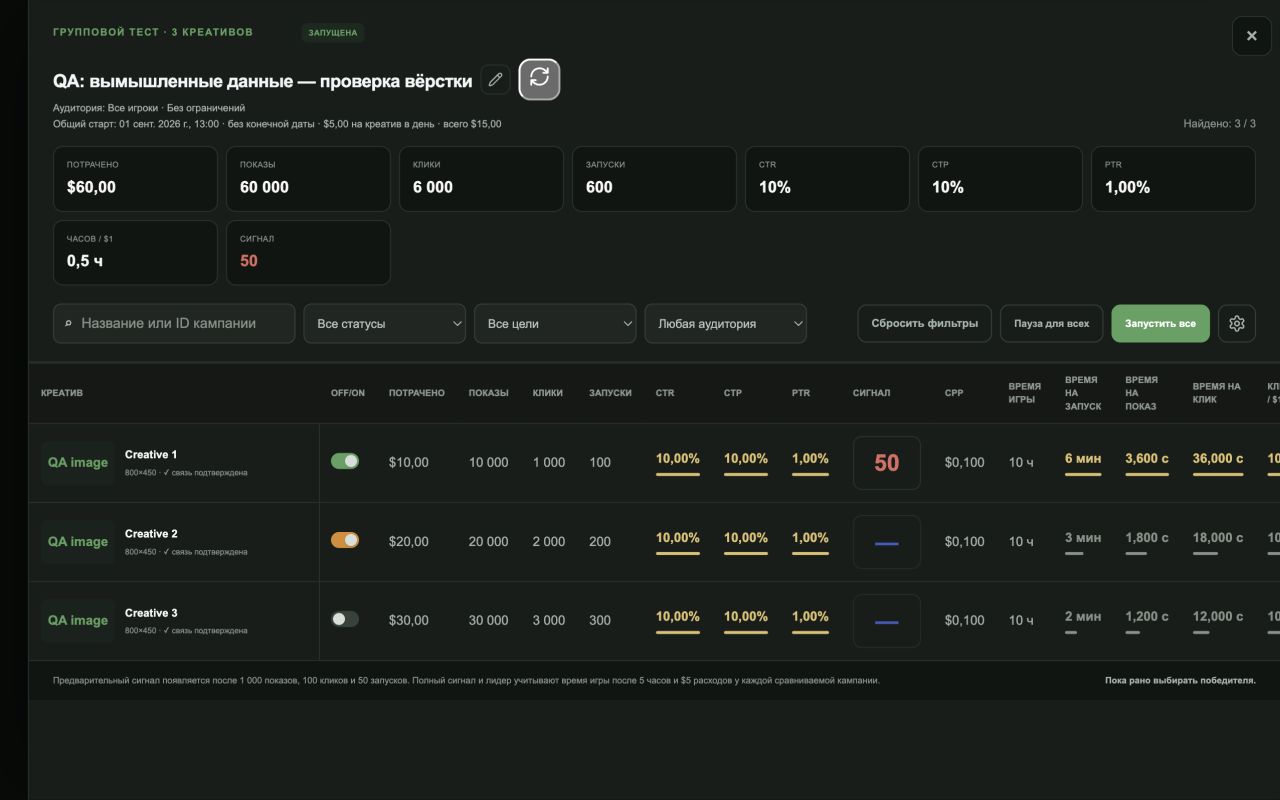
Signal 0–100 is a comparative MARPLA model for the current period, not a Roblox rating. The final signal weights playtime hours per $1 at 30%, PTR at 20%, CTR at 12%, CTP at 8%, and time per impression, click and play at 10% each. A row enters the comparison after 1,000 impressions, 100 clicks and 50 plays.
Until every compared row has at least 5 hours of attributed playtime and $5 of spend, playtime is excluded from all signals together and the preliminary score uses conversions only. Red means an insufficient sample, yellow a preliminary conversion-only estimate, green a fully comparable signal and gray missing exact Roblox data. Small samples are additionally shrunk toward the comparison cohort.
Group totals always use summed source values. In a group test, each row uses its campaign's only creative as the label and preview while the numbers cover that entire campaign. Data from a neighboring campaign or the group's aggregate is never substituted.
Advertising overview metrics
Impressions, Clicks, CTR, Plays, Spend and Playtime per $1 use Ads Manager campaign reports for the selected range. Impressions and clicks here are advertising events. CTR = total clicks ÷ total impressions × 100%, using only campaigns with both values.
Playtime per $1 = total hours ÷ total spend for campaigns with both values, not an average of ratios. For example, 600 hours ÷ $100 = 6 hours per $1. A partial X/Y caption shows campaign coverage when the response is incomplete; missing values are never replaced with zeros.
Zero spend gives no ratio; confirmed zero hours with positive spend gives zero. The report chart shows available advertising-event history and opens an available metric if the selected one was not returned. One chart card switches between Ads Manager events and daily unique Sponsored Ads users from AcquisitionSource.
Users with impressions/clicks/plays and All/New/Returning users select unique audiences; report metric buttons return to Ads Manager data. The sources are never added together. AI advice and notes follow the selected chart; the report offers advertising advice.
The warning beside the heading explains incomplete coverage. Milestones shows saved observations of campaign budget, targeting, delivery status and creative changes. Hover a marker to read the change.
Its date is when MARPLA observed it, not a confirmed launch time. Group charts include only member campaigns and markers within the selected range. No markers are invented when configuration history has not been collected.
Group refresh and history
The group panel slides in from the right; on close it slides back to the right and is removed only after the exit finishes. Transitions are disabled when reduced motion is enabled. The AI advice button sits below the chart title on the left and follows the selected chart metric.
The square button at the right of the test name uses one request for fresh campaign-level status, spend, impressions, clicks, plays, playtime and Robux earnings. Partial Roblox responses preserve available values and display warnings. Refreshes within one minute use the latest results.
Stopped campaigns remain in the table with gray figures and bars but are excluded from signals, leaders and performance tiers. Among enabled campaigns, green is the upper third, yellow the middle and red the lower; ties share one tier. Gray signals mean insufficient samples or missing data; accuracy is explained in the tooltip.
Historical spend from every campaign remains in table totals. Below the table, metric buttons can be dragged and their order is saved on this device; Alt plus arrow keys also reorders them. All chart lines start hidden when a group opens: select creatives or Show all lines.
Source warnings are in the collapsed Data status section. Line toggles show creative thumbnails and colored dots. The guide icon sits beside the metric selector.
The legend toggles each campaign line and the enabled-campaign total without controlling ads. Table filters apply to the chart. Controls include range, dates within that range, daily/weekly/monthly steps and standard chart modes.
Long ranges request monthly source data. Ratios are calculated after summing underlying counts, never by averaging percentages. Signals require sufficient samples.
History uses exact Roblox Campaign IDs and is cached for one hour; changing metrics, filters and lines sends no Roblox requests. Missing detail or delayed attribution is never replaced with invented points derived from a period total.
Saved reports and refresh
The table and chart read saved MARPLA data. Refresh never clears previous results: when Roblox omits a campaign or is unavailable, its last report remains visible. For a stopped group, the list shows its saved result for the selected period.
Group settings switches between the saved stop result and current data and shows the capture date, reporting range and finalist count. In the main campaign table and inside a group, Clicks / $1, Impressions / $1 and Plays / $1 divide each count by spend for the same campaign and reporting range. Group rows divide summed counts by summed spend; incomplete group inputs produce a dash.
Colors compare rows for the same period: more events per dollar ranks higher, and bars show the share of the maximum. Inside a group, only serving campaigns or saved-result finalists enter the comparison. These metrics are also included in the main table CSV.
Headers sort by exact values; display uses up to two decimals. Missing data or zero spend gives a dash; a confirmed zero count with positive spend remains zero. Automatic tests show their shared audience in a plain line; expandable per-campaign settings are available only in manual groups.
Creative-row figures are larger for readability. Hover a metric for the report period and retrieval time. This is the response retrieval time, not a guarantee that all Roblox metrics are complete.
Missing values are filled only within the same period; different reporting periods are not added to a combined total. Sync requests the selected period. The background queue rechecks short periods every 15 minutes, 30 days hourly, 6 months every six hours, and one year/all time daily; Roblox errors and rate limits can delay retries.
An open page automatically rereads saved data. Empty responses do not delete daily chart history. If data has never arrived, MARPLA shows missing data rather than invented zeroes.
Time per impression, click and play
Compare three ratios of attributed in-game time: Time per impression = hours × 3600 ÷ impressions; Time per click = hours × 3600 ÷ clicks; Time per play = hours × 60 ÷ plays. The first two show seconds with three decimal places; the third uses minutes. Only the display is rounded: calculations, sorting, colors, bars, Signal and CSV keep the full original precision.
This is time acquired players spend in the game, not ad display duration. Plays are not unique players. For example, 10 hours, 10,000 impressions, 1000 clicks and 100 plays yield 3.600 s/impression, 36.000 s/click and 6 min/play.
Click a heading to sort. Colors indicate lower, middle and upper thirds of comparable rows; bars show the share of the maximum. These are relative comparisons, not universal targets.
Paused campaigns are excluded from a group's live comparison. Metrics appear in campaign, creative and group tables, selection history, CSV and charts. Groups divide sums instead of averaging ratios.
Inputs must cover the same period; missing inputs or a zero denominator show No data. Confirmed zero time with a positive denominator shows 0. Partial overview charts are labeled.
MARPLA Signal v2 assigns the time ratios a shared 30% weight, 10% each; hours/$1 gets 30%, CTR 12%, CTP 8% and PTR 20%. Related metrics are not independent evidence. All time metrics require two comparable rows, each with at least 1000 impressions, 100 clicks, 50 plays, 5 hours and $5.
Until then sample gates and preliminary conversion scores apply. Roblox may revise attribution for up to 48 hours. Saved stopped-test results retain their original formula.
Useful articles: examples and decisions
The guide covers the steps in the service. These articles explain the metrics, examples, techniques and how to evaluate results.
Roblox advertising: when to launch, how to target, and when to stop
A practical Roblox advertising guide: objectives, targeting, budgets, organic traffic, and pause decisions. Real interface screenshots and MARPLA workflows.
Read article →
Roblox ad creatives: a testing plan and results review
Test Roblox ad creatives with a hypothesis card, change log, and comparisons of CTR, plays, and spend. Includes a worked example and downloadable template.
Read article →