Investigate Home and new audiences
Check source, countries and cohort maturity to separate audience-mix changes from a worse game experience.
How to use it
- In MARPLA, the six Home cards show available Home-only values; P50/P90 are general game benchmarks. Click for history. In Creator Hub, open Acquisition → Home Recommendations: check impressions, PTR and early bounce, then play days and time in available mature windows. Confirm that the change concerns organic RFY.
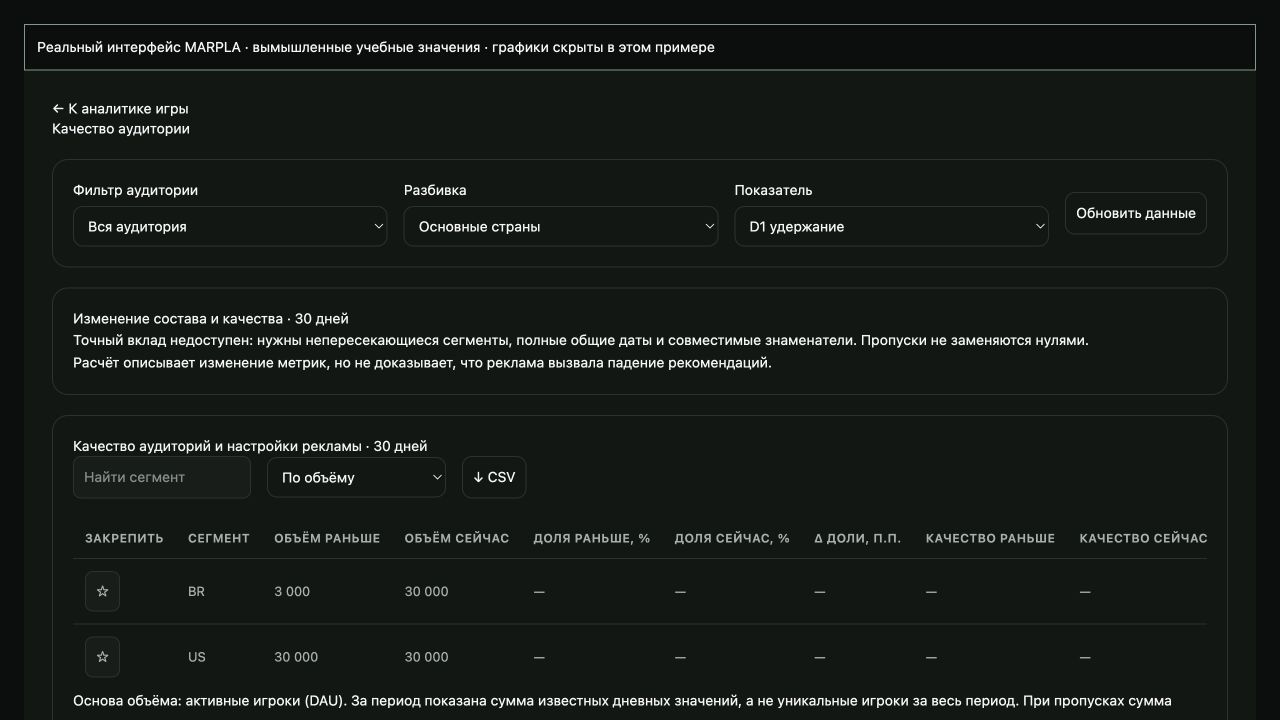
- In MARPLA, open your game → Audience quality. Clear an unwanted filter, choose countries and a metric, and enable chart lines. Inspect an available joint country/device breakdown; independent totals do not replace joint observations.
- Compare equally mature cohorts and complete days. Check whether a new country gained share or quality deteriorated inside established segments. If D1 cohort sizes are unavailable, do not calculate composition effects using DAU.
- In Content → Home, compare set dates and membership; add a milestone or note with the build, translation and next checkpoint. Repair one confirmed entry barrier and evaluate a new post-fix cohort.
Advice and practical context
What to repair for a new country
Start with an observable first barrier: goal translation, loading on a phone, connection failures, controls or an empty server. Low monetization alone does not make an audience poor. Compare source, maturity and cohort sizes; check whether established countries deteriorated at the same time. If they all did, investigate a product regression or load rather than geography alone. Separate the short-term traffic spike from longer return windows: they answer different questions.
Plan the next checkpoint
Record the date, build, Home set membership, translation change and hypothesis. Choose one small test and decide in advance which observation would support the fix. Compare complete days and equal maturity. Do not change everything because of one weak day. There is no public country-targeting switch for organic RFY; ad targeting does not control it. The useful article below includes primary sources, country cases and a downloadable investigation card.
Technical detailsCalculations, permissions and behavior
Home: source, expansion and new countries
First distinguish organic Recommended for You from Sponsored, Continue and other Home sources. Roblox currently describes candidate retrieval using evidence from multiple channels, while RFY ranking uses users organically acquired through RFY. Key signals include PTR, early bounce, play days and playtime; D2–7 and D8–28 add evidence as they mature without making a new game wait 28 days for ranking.
Audience expansion can lower a blended average without deterioration in established segments. Country is not language or device, and Roblox discloses no mandatory country sequence. Inspect actual availability and warnings separately from recommendations.
Audience quality displays supported breakdowns actually received. Do not create source × country observations from independent totals. The table compares the latest 30 complete days with the previous 30; charts have separate ranges and sources can overlap.
Do not weight D1 with DAU. Missing denominators mean the exact composition contribution is unknown. In Home history, preserve membership, period and change date.
Creative QPTR is not the full ranking signal set. L7 is a rolling snapshot and cannot be summed across days. Changing thumbnails, the game and ads together complicates causal interpretation.
Milestones and notes record a hypothesis; they do not prove it.
Home audience benchmarks
The Home Recommendations report includes the same six cards, daily and seven-day average switches, and date controls. D1 and D7 values use only the exact AcquisitionSource Home breakdown (HomeRecommendation in the API); PTR already measures Home recommendations. Whole-game values and percentiles never substitute for Home D1/D7.
Comparison uses the latest available period with both a Home value and P50/P90; its date is shown on the card. The rail shows Below P50, Between P50 and P90, or Above P90: a comparison band, not a calculated exact percentile. The dot places the Home value relative to P50/P90 on an illustrative value scale; its position is not an exact percentile.
Colour fills the rail from its start to the dot; the remainder stays grey. The colour progresses from orange and yellow to lime before P50 and green from P50 onward. P50/P90 remain general Roblox comparable-game benchmarks, explicitly labelled: they are not a distribution of Home audiences.
Average playtime, payer conversion and ARPPU use whole-game values, percentiles and history labelled Whole game because the source does not support a Home breakdown. RFY D1 Playtime and Robux Spend have different definitions and do not substitute for these metrics. Clicking a card opens and scrolls to history for the audience labelled on the card below, retaining the card end date.
A seven-day average requires seven consecutive mature days; gaps are not filled with zero. Data refreshes automatically and through the chart refresh button; saved history remains visible on failure.
Useful articles: examples and decisions
The guide covers the steps in the service. These articles explain the metrics, examples, techniques and how to evaluate results.
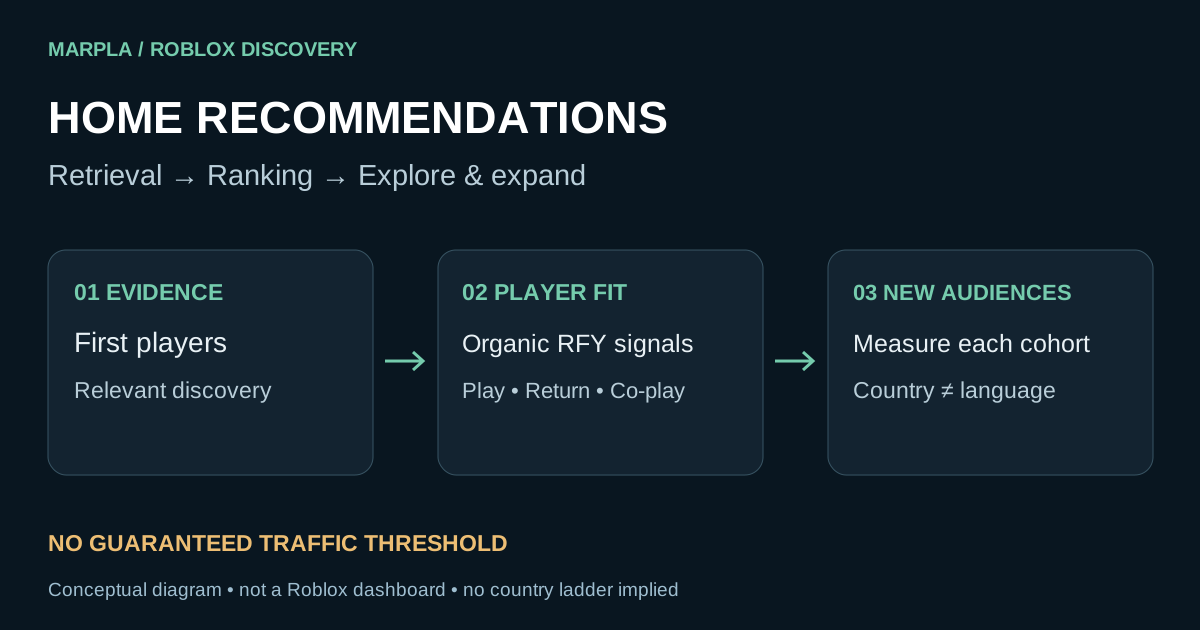
Action essentials and individual concepts (9)
 Roblox Home recommendations: action plan
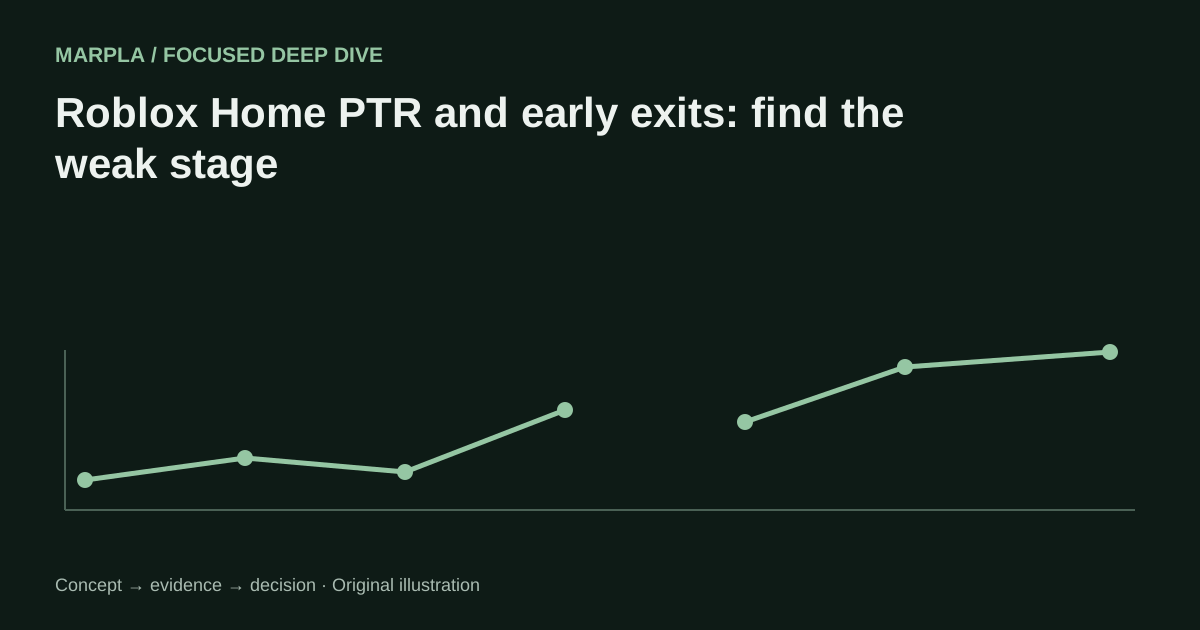 Roblox Home PTR and early exits: find the weak stage
 Roblox country cohorts: explain audience-mix changes
 Roblox localization and performance: diagnose early exits
 Paid and organic Roblox traffic: avoid attribution errors
 Roblox Home thumbnail personalization: read an adaptive test
 Roblox first-session diagnosis: from loss shape to repair
 Roblox launch operations: access, roles, stop conditions, rollback
 Roblox launch cohorts: measure an update without mixing sources